- Cardano trades near $0.798, with resistance stacked at $0.83–$0.85 and support at $0.78.
- ETF approval odds sit at 91% by late October, boosting sentiment but not guaranteeing a breakout.
- Derivative data shows bullish bias, but weak options activity leaves ADA exposed to volatility shocks.
Cardano (ADA) is trying to claw its way back after last week’s dip, trading near $0.798 at press time. Buyers have stepped in around the $0.78 zone, defending support, but the market is still struggling under key moving averages. The big question now—can ADA reclaim the $0.83–$0.85 band, where resistance stacks up with both the 50-day EMA and Fibonacci levels?
ADA Price Facing Thick Resistance
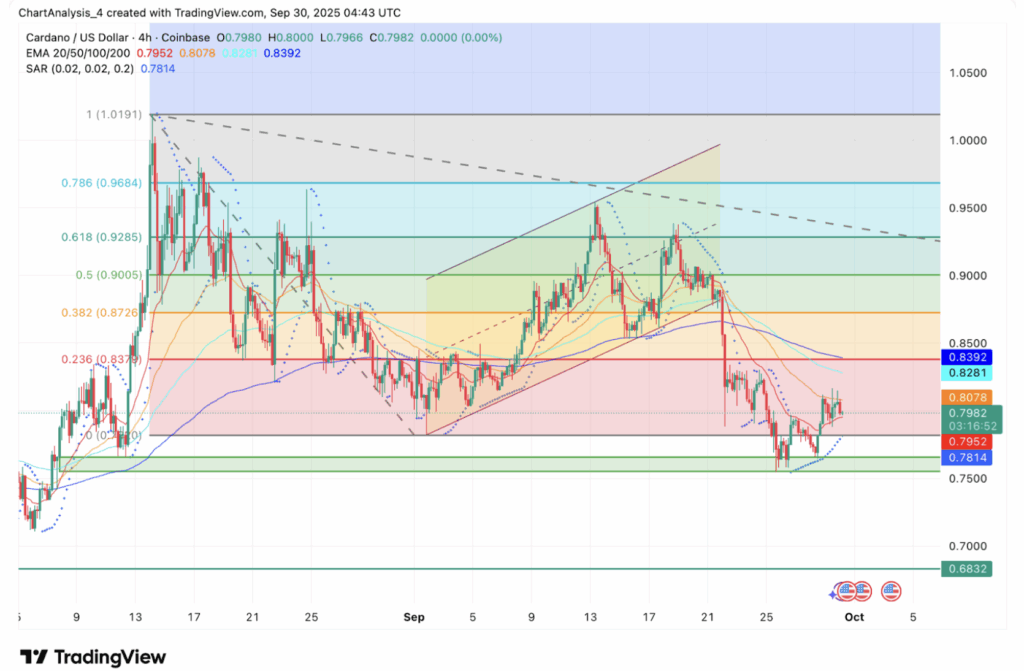
On the 4-hour chart, ADA is caught in a tight consolidation between $0.78 and $0.83 after falling back from September highs above $0.95. Price action is pinned below the 20-day EMA ($0.80), while stronger resistance sits overhead with the 50-day and 100-day EMAs at $0.82–$0.83. Add the 200-day EMA at $0.84, and you’ve got a cluster that’s tough to crack.
If bulls manage to push through, upside targets sit at $0.87 (Fib 0.382) and $0.90 (Fib 0.5). On the downside, immediate support is at $0.78, with deeper cushions near $0.75 and $0.71. Momentum signals remain mixed—the RSI is bouncing back from oversold but hasn’t confirmed bullish divergence, while Parabolic SAR dots still hover above price, keeping the short-term trend tilted bearish.
ETF Buzz Adds Fuel to the Narrative
Speculation around a Cardano spot ETF is heating up. Prediction markets now give a 91% chance of approval by October 26, sparking debate about whether ADA could see inflows like Bitcoin and Ethereum did earlier this year. Analysts argue even modest institutional allocations could provide liquidity support, though timing may not sync with short-term technical setups.
The ETF hype has clearly improved sentiment, but traders remain cautious—watching whether narrative momentum can overcome the resistance cluster on charts.
On-Chain Flows Show Mixed Signals
Derivatives data shows rising activity. Open interest sits at $1.41B, slightly higher on the day, while trading volume surged 26% to $2.03B. On Binance, the long/short ratio is heavily bullish at 3.14, showing leveraged traders are leaning on the upside.
That said, options activity is way down—92% lower than recent weeks—suggesting a lack of hedging against volatility. Liquidation data shows around $732k wiped in 24 hours, with longs taking most of the pain. The picture? Recovery looks fragile, and without hedging, sharp moves could still sting.
Why Fundamentals Still Matter
Looking past near-term noise, Cardano continues to build its long-term case. The network has run for over eight years without downtime or hacks, something few blockchains can claim. That stability makes ADA attractive to institutions who might view it as less speculative compared to riskier altcoins. With ETF speculation in the mix, that track record could become a major selling point.
Technical Outlook: ADA Levels to Watch
- Upside targets: $0.83–$0.85 (EMA cluster), $0.87 (Fib 0.382), $0.90 (Fib 0.5).
- Support zones: $0.78, $0.75, and deeper at $0.71.
- Trend support: $0.68 remains the key long-term defense line.
A daily close above $0.83 would flip structure bullish and open a path to $0.90. Failure, however, could drag ADA back toward $0.75 or worse.
Will Cardano Go Up in October?
For now, ADA remains stuck in a range. Technicals flash caution, but open interest, bullish leverage ratios, and the ETF catalyst give buyers a fighting chance. If momentum holds, ADA could test $0.90–$0.93 into October. But if $0.78 cracks, sellers will likely drag it down to $0.75 or even lower.
Cardano sits in that awkward middle ground—optimism building, resistance thick, and traders watching closely for a decisive move.