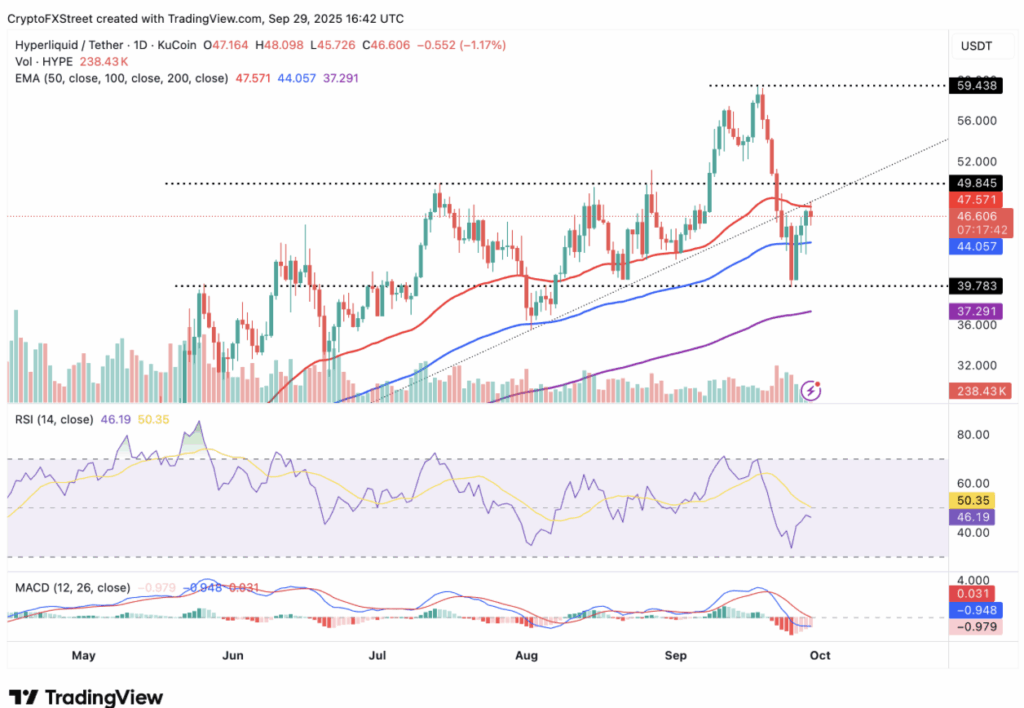
- HYPE price trades above $46 after a 33% drop from September highs, with support near $39.78 holding firm.
- Strong DeFi metrics: $2.21B TVL, $3.94M daily fees, and $84B cumulative volume back its market position.
- Key levels: $47.57 resistance and $50 breakout target; downside risks if $44 and $37 supports fail.
Hyperliquid (HYPE) has been riding out some wild swings lately. After hitting its all-time high near $59.43 on September 18, the token slid nearly 33% to test support at $39.78 last Thursday. By Monday, HYPE was trading back above $46, but the volatility has left traders on edge—wondering if momentum can carry it higher or if another leg down is brewing.
DeFi Metrics Show Underlying Strength
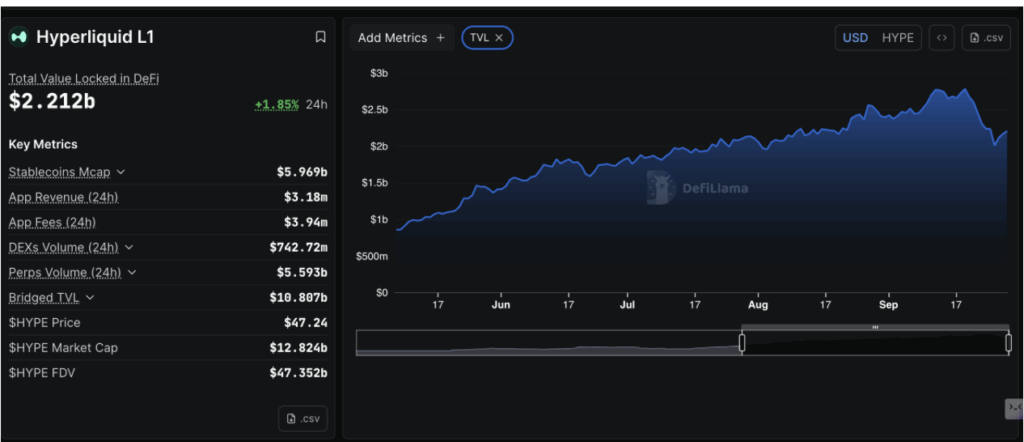
Despite the sharp correction, Hyperliquid’s fundamentals look far from weak. Its DeFi Total Value Locked (TVL) sits at $2.21 billion, up almost 2% in 24 hours. That’s still below the record $2.78 billion reached in mid-September, but well above last week’s dip to $2.01 billion. The rebound in TVL suggests capital is sticking around, even with broader crypto market turbulence.
Protocol data also paints a bullish backdrop. Daily fees average $3.94 million, with revenues at $3.18 million—numbers that keep Hyperliquid at the top of the decentralized perpetuals game. Add in a staggering $84 billion in cumulative trading volume and the backing of its USDH stablecoin, and it’s clear the DEX isn’t losing relevance any time soon.
Futures Open Interest Signals Market Confidence
Hyperliquid futures’ Open Interest (OI) has stabilized near $2.3 billion, showing that traders are staying engaged. OI reflects the notional value of all futures contracts, and steady levels suggest the market isn’t panicking. Instead, it’s leaning toward gradual stability, a setup that could allow price to grind higher. As long as speculative interest holds, bulls may find the conditions ripe for another breakout.
Technical Outlook: Key Levels to Watch
Technically, HYPE is caught between its 100-day Exponential Moving Average (EMA) at $44.05 and resistance at the 50-day EMA near $47.57. Breaking above $47.57 could set up a push to retest the psychological $50 barrier, and from there, the ascending trendline may fuel further upside momentum. A confirmed buy signal from the MACD would only strengthen the bullish case.
On the flip side, losing the 50-day EMA could bring more selling pressure. A drop below the 100-day EMA at $44 might open the door to deeper losses, with the 200-day EMA down at $37.29 acting as the next major support. For now, traders are watching closely—Hyperliquid’s dominance in the perpetuals market and its steady buyback program could keep the bullish flame alive, but the charts leave little room for error.