
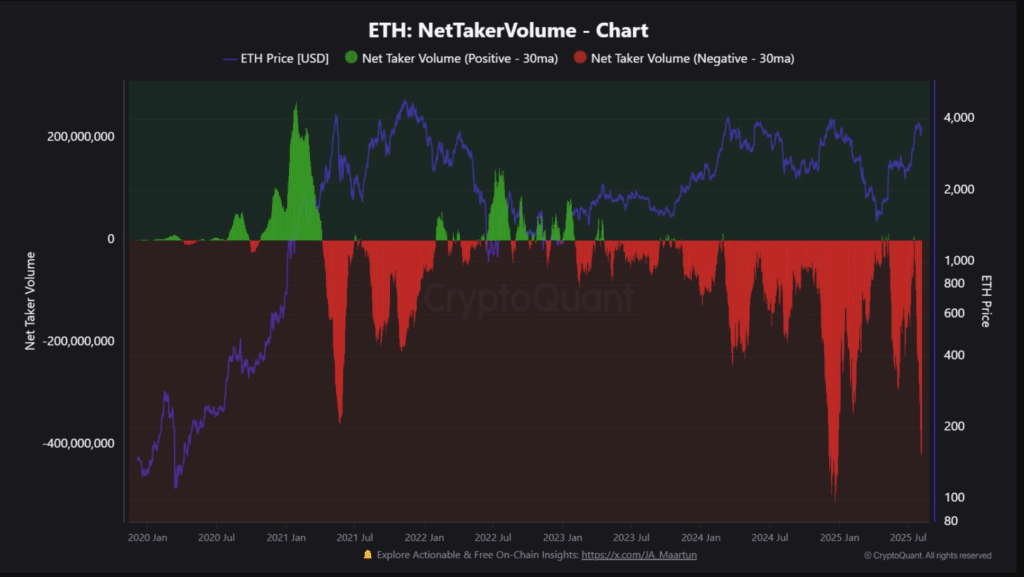
- ETH’s Net Taker Volume hit -$418.8M, the second-largest daily sell imbalance in history.
- Price is retesting the critical $3,600–$4,000 resistance zone that capped prior rallies.
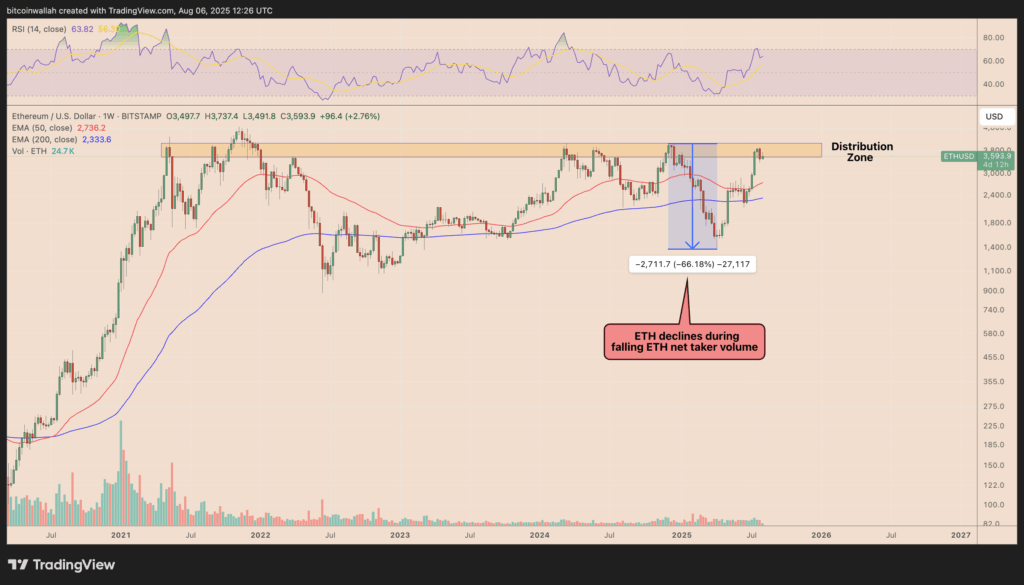
- Historical patterns suggest a potential 25%–35% drop toward $2,736–$2,333 by September–October.
Ethereum is flashing potential local top signals as Net Taker Volume plunged to -$418.8 million, the second-largest daily sell imbalance ever recorded. This equates to 115,400 more ETH sold than bought via market orders, according to CryptoQuant. Such extreme taker sell dominance typically reflects urgency or fear among traders, often aligning with profit-taking or short-term capitulation phases.
Retesting Key Resistance at $4,000
The spike in sell-side pressure comes as ETH trades between $3,600 and $4,000, a historically significant resistance zone that has repeatedly capped rallies since 2021. This setup mirrors December 2024, when similar negative Net Taker Volume readings preceded a major reversal. Back then, ETH plunged 66%, falling toward its 50-week and 200-week EMAs.
Downside Targets Into September–October
If history rhymes, ETH could be poised for a 25%–35% drop, potentially revisiting the 50-week EMA ($2,736) or the 200-week EMA ($2,333) by early Q4 2025. The weekly RSI has also started to cool from overbought territory, reinforcing the possibility of a corrective phase.
Technical Watchpoints
- Resistance: $3,600–$4,000 remains the major distribution zone.
- Support: First strong levels at $2,736 (50W EMA) and $2,333 (200W EMA).
- Momentum: Overbought conditions fading; negative Net Taker Volume historically marks local tops.