- Bitcoin reclaimed $108K with analysts projecting a move toward $123K–$162K as bullish patterns emerge.
- Institutional entry zones and wedge breakouts signal a new rally phase; $110.4K is the level to watch.
- Whale activity and record-high leverage hint at rising speculation and possible explosive price action.
Bitcoin’s back in the spotlight after clawing its way past $108,000 this week. Some analysts are already tossing out bold targets—anywhere from $123K to a wild $162K. Yeah, you read that right. And with the way the charts are shaping up, this next leg might be just getting started.
Institutions Are Quietly Loading Up—Again
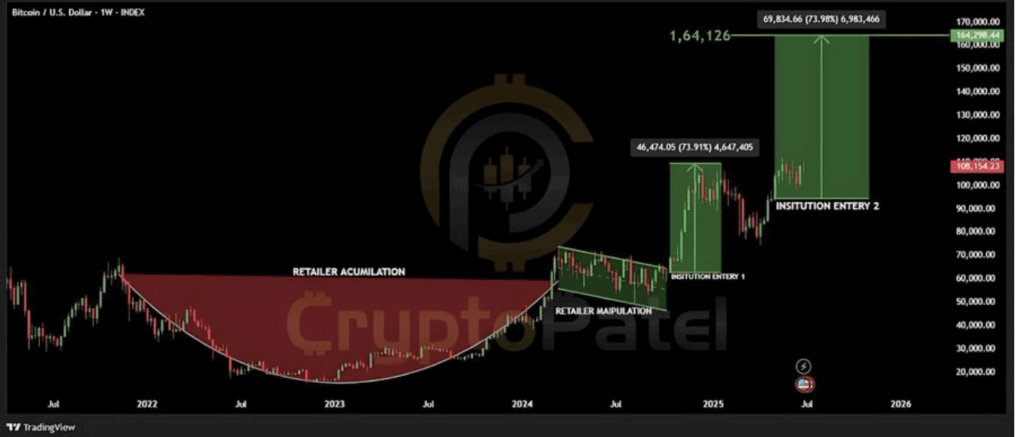
According to Crypto Patel (one of those guys always drawing squiggly lines on X), Bitcoin’s moved into what he’s calling the “institutional phase.” Basically, we’ve been through the slow grind—the whole boring accumulation thing from 2022 to early 2024—and now we’re back in that phase where big players are loading their bags.
Patel’s chart highlights two major areas where institutions stepped in. The first one? That took BTC to $107K back in Jan. The second wave seems to have kicked off after BTC based out at $96K in June. And if history rhymes (it usually does in crypto), he’s pegging $162,000 as a cycle top. Lofty, yeah, but hey—it’s crypto.
Wedge Breakout Hints at More Upside
CryptoWZRD, another chart whisperer, says Bitcoin just broke out of a falling wedge pattern, which usually means a bullish trend shift. BTC popped out from $91K and sprinted up to $108K. The daily close did cool off a bit, so it might either keep climbing—or pull back slightly before the next move.
Here’s the key: $110,400 is where things get real. If BTC closes above that level, bulls could push toward $120K. But if $105,500 gives way (that’s where the wedge breakout happened), we might slide back down to $100K territory. WZRD also tossed in a warning about geopolitical jitters and said if Bitcoin dominance dips, we might see altcoins wake up again.
Megaphone Pattern Calls for $123K Target
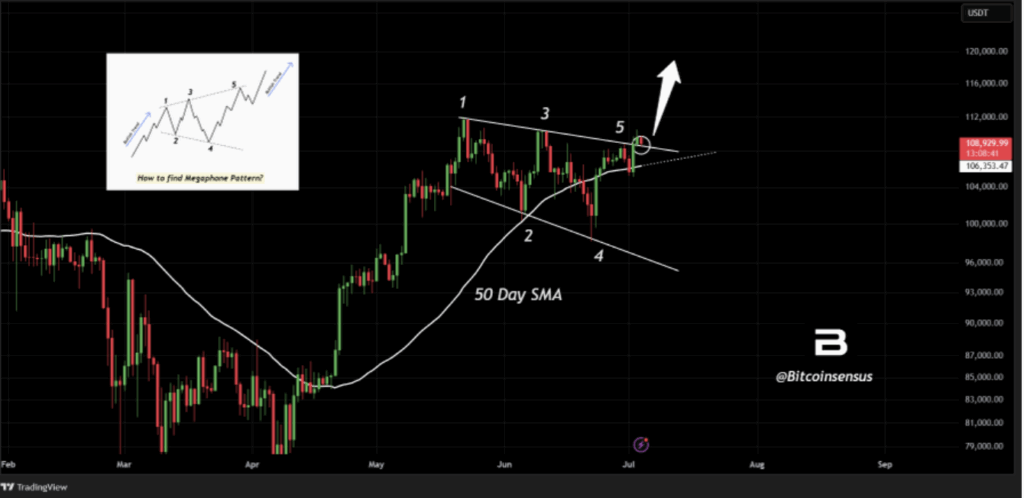
Bitcoinsensus chimed in with another angle—a giant megaphone pattern. Think of it like BTC shouting into a bullhorn: higher highs, lower lows, and then, usually, a loud breakout in the opposite direction of the last trend.
Right now, BTC is butting up against the top of that pattern. If it breaks through (and doesn’t get rejected), the chart points to a $123K target. And with the 50-day moving average holding like a champ since March, the setup’s looking clean. All eyes on a weekly close above $110.5K… that’s the green light.
Leverage and Whale Games Stir the Pot
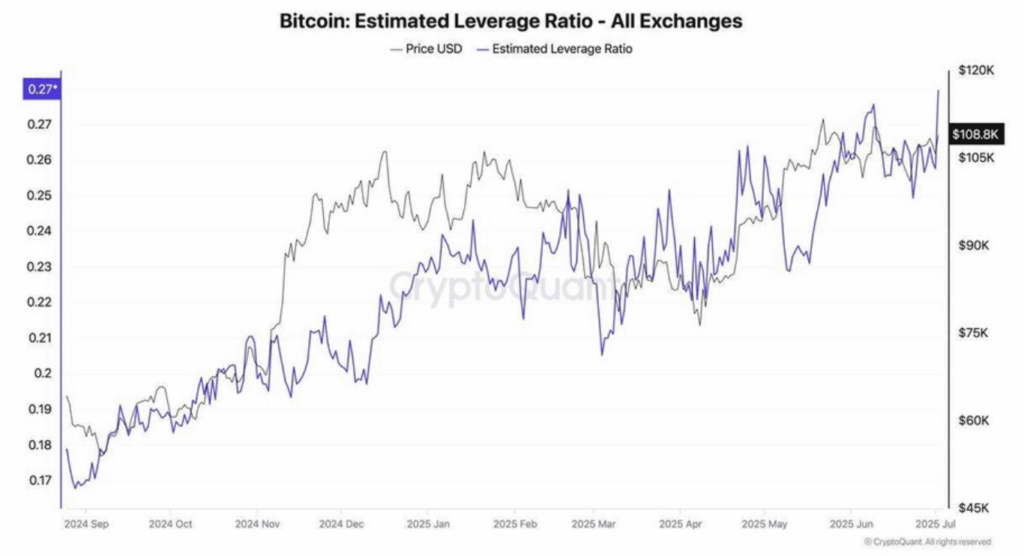
And then there’s leverage—always a wildcard. CW pointed out that the leverage ratio across exchanges just hit a yearly high at 0.27. That kind of thing usually means traders are getting gutsy. Could be good, could be reckless, but it definitely makes things spicy.
Oh, and get this—a whale woke up after 14 years. On July 4, someone moved 80,000 BTC that they bought for pennies back in 2011 (like, literally under $4). They didn’t sell… just moved it. But moves like that always get the rumor mill going.
BTC’s bounced from around $97.5K to $108.1K this past month, so while the move might look small (+3%), the pressure is clearly building. If it breaks clean, strap in.