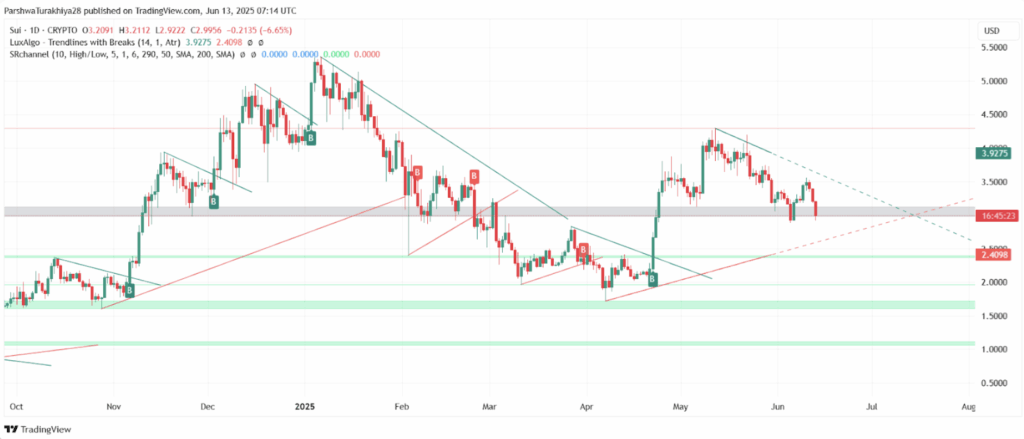
- SUI has broken key support at $3.11 and is trading near $2.99, with momentum heavily favoring the bears.
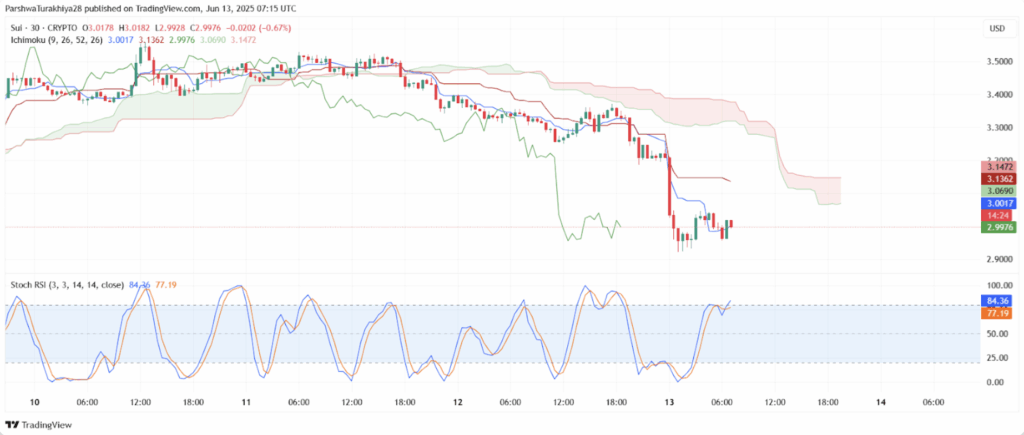
- RSI, MACD, and Ichimoku indicators all confirm bearish strength, while $2.58 is now a critical support level.
- Unless the price reclaims $3.11 soon, further decline toward $2.40–$2.57 looks likely.
SUI’s recent price action has taken a turn for the worse, and not in a small way. After trying and failing to push past the $3.35 mark, the token dropped hard—slipping to around $2.99 at the time of writing. This latest rejection wasn’t just any hiccup; it hit right at the confluence of an old support block and a stubborn descending trendline. Now, without a solid bounce soon, things might keep trending down.
Zooming out a bit, you’ll see SUI has lost the 0.382 Fibonacci level at $3.11, which had been acting like a critical pivot for weeks. Breaking below that is kinda like losing a safety net. Weekly losses are stacking up too, nearly -7% in just days. If this slide continues, it could fall all the way to $2.57, or worse, back toward that March support area around $1.71.
Technical Breakdown Spooks Bulls
Shorter timeframes show just how brutal this breakdown has been. The $3.10–$3.15 range once looked solid, held up by trendlines and a group of key EMAs. That zone crumbled. Now, even a weak bounce near $3.00–$3.02 is struggling. The price is stuck under all major moving averages, and the 200-EMA near $3.39 is now a ceiling instead of a floor.
Bollinger Bands are widening fast too—classic sign of volatility picking up. The lower support is shaping up near $2.58, with a bit of psychological backup at $2.40. If buyers can’t defend that region, SUI could spiral even lower.
Momentum Indicators Signal Weakness
Every momentum gauge is flashing red right now. The RSI dropped to 29.5, barely recovering from oversold territory. MACD? Still bearish across the board. Signal lines are buried, histogram’s stuck in the red.
The Ichimoku Cloud isn’t painting a pretty picture either. Price is hanging below the cloud, and both the Tenkan-Sen and Kijun-Sen lines are aligned downward. Even the Stochastic RSI, while curling up a bit, doesn’t look confident—this could be a dead-cat bounce or just a pause before more red candles.
Why SUI’s Getting Hammered
At the core of this downturn is the inability to flip $3.30 into support. That key resistance, paired with the 50-day EMA, held firm and sparked a cascade of sell orders. Once stops below $3.10 were hit, the slide gained steam. Broader market jitters and risk-off sentiment in altcoins haven’t helped either.
With that kind of pressure, it’s no wonder SUI’s heading south. Traders now have their eyes glued to the $2.58 zone, hoping it holds.
What’s Next? The Clock’s Ticking
If SUI doesn’t reclaim $3.11 soon, expect more downside—likely toward $2.58 or even $2.40. But if bulls can somehow regain control, the price will need to battle through a wall of resistance at $3.30, $3.55, and $3.92. It’s gonna be an uphill climb either way. For now, the trend’s still down, and the burden’s on the bulls to flip the script.