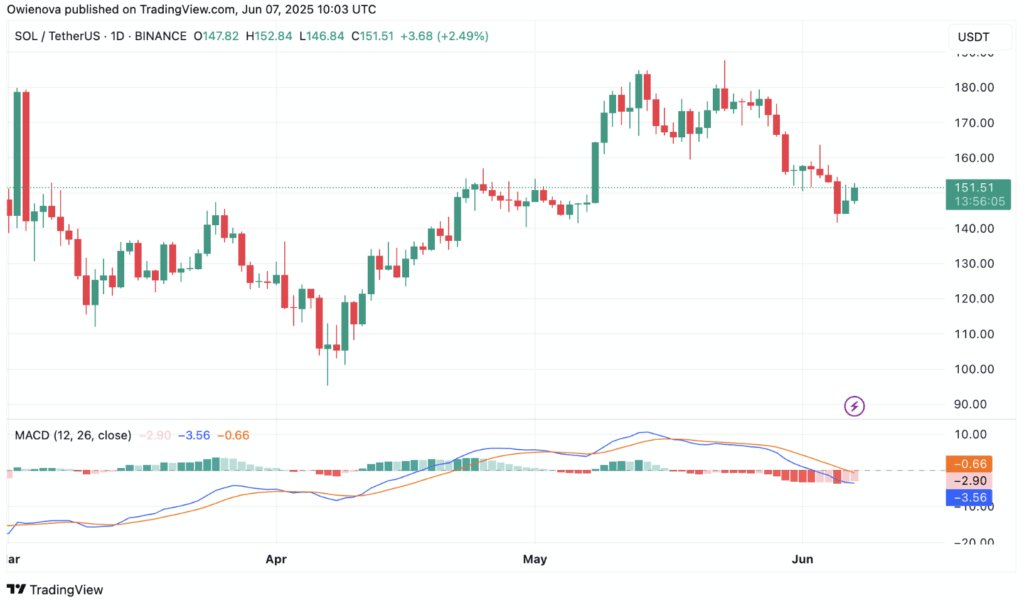
- Solana is tightening into a breakout-ready range on lower timeframes, with support holding near $145 and resistance building at $155.
- Despite a descending triangle suggesting bearishness, bullish patterns like the Shark harmonic and wedge formations hint at a reversal toward $180–$265.
- Volume is rising and indicators are flashing oversold, signaling pressure is mounting for a potential explosive move in either direction.
Solana’s looking like it’s about to make a move—but which way is still anyone’s guess. On the 15-minute chart, price action’s tightening up like a coiled spring, hinting at a possible breakout. The range is getting narrower by the hour, and that kind of squeeze usually doesn’t last long. Traders are watching closely as SOL gears up for what could be a sharp directional shift.
Buyers Bounce Back After Sudden Dip
Earlier, SOL got smacked down below $142 during a quick sell-off, but it didn’t stay there long. According to analyst Andrew Davis, buyers jumped in almost instantly, pushing the price right back above $150. That bounce shows there’s still plenty of interest and suggests the market’s got some backbone. If that momentum sticks, we could be looking at more upside ahead.
Descending Triangle vs Bullish Pattern? It’s Complicated
Crypto watcher Gemxbt spotted a descending triangle on the hourly chart, typically seen as bearish. It shows lower highs forming while SOL clings to that $145 support—held firm several times now. Still, despite the bearish vibes, SOL bounced off the support zone again, showing a flicker of bullish resistance. Breaking through $155 would be a solid confirmation that the tide’s turning.
Meanwhile, over on the 4-hour chart, Giottus Exchange highlighted a bullish Shark harmonic pattern. The D-point landed at the 1.618 BC extension, right around $147—a known reversal spot. If this pattern holds up, SOL might be looking at targets in the $180 to $190 range. It’s not a guarantee, but it’s one more reason for the bulls to pay attention.
Wedge Breakout Brewing?
Whales_Crypto_Trading chimed in too, pointing out that Solana’s sitting just under a wedge resistance on the 4-hour timeframe. The pattern—wide at the bottom, tighter at the top—often shows up before big breakouts. Volume’s creeping up too, another clue that something’s brewing. If SOL pushes past this upper wedge line, the next possible stops could be $215, $228, $243… maybe even $265.
Right now, Solana’s in a kind of pressure cooker. The charts are sending mixed signals, but one thing’s clear—whatever happens next, it probably won’t be boring.