Crypto prices displayed weakness as bears sold on recent minor rallies amidst the lack of a strong catalyst and a resilient U.S. Dollar Index (DXY). The total crypto market capitalization is just over $920 billion, down 0.62% in the last 24 hours. The largest cryptocurrency by market value, Bitcoin (BTC), was exchanging hands at $19,159, 0.6% off on the day, according to data from TradingView and CoinMarketCap.
Meanwhile, investor activity shows that the amount of Bitcoin moving out of exchanges has increased over the last couple of days, implying that sellers may be exhausted. So is Bitcoin forming a bottom?
Bitcoin Exchange Outflows Surge
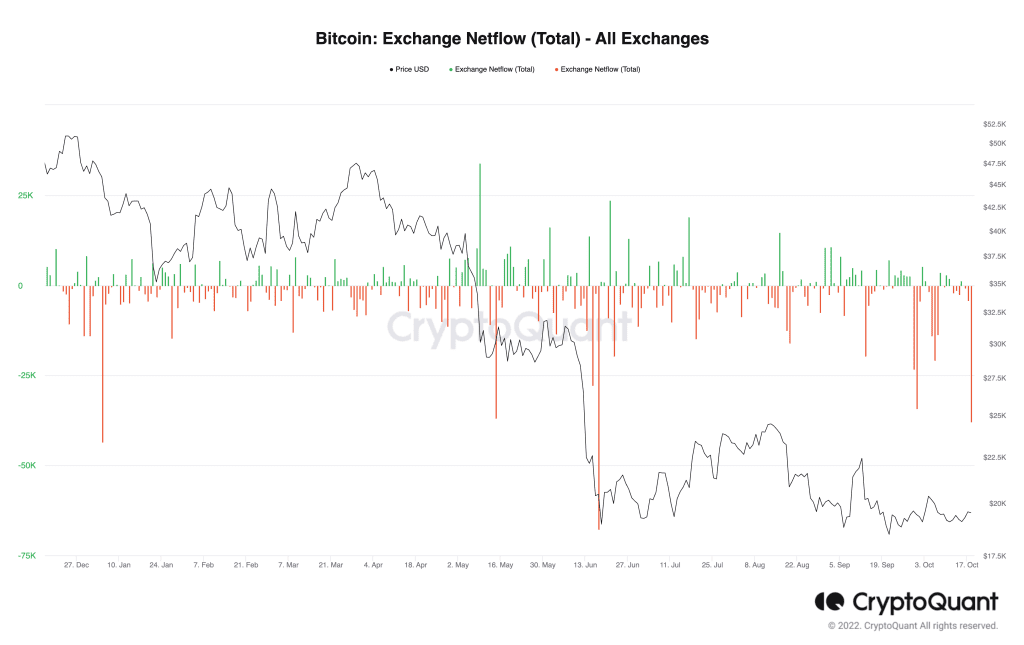
On-chain data suggested that investors may be accumulating Bitcoin for the long term. Data from CryptoQuant, an on-chain data analysis platform, showed 37,800 BTC (worth about $742.2 million at current prices) left crypto exchanges on Tuesday, October 18. It is worth noting that this is the largest daily outflow of the big crypto since mid-June, when traders took almost 68,000 BTC from exchanges.
According to the blockchain analytics firm, aggregate outflow from all exchanges in the past 30 days stood at 121,000 BTC or close to $2.31 billion at current prices.

Traders usually move their coins from trading platforms because they want to hold them for longer rather than sell them. Therefore, the increase in Bitcoin outflows from known exchange wallets is seen as a bullish signal.
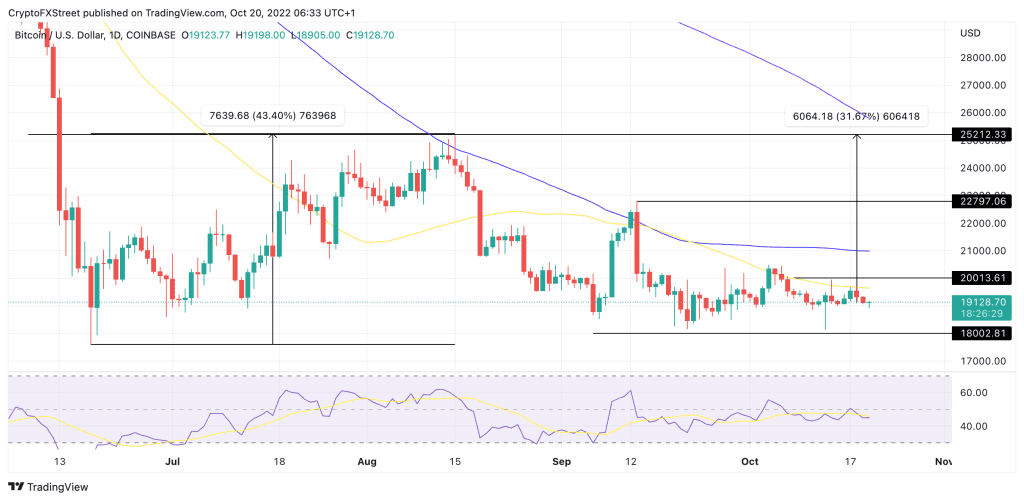
This was evident when Bitcoin bottomed out just below $18,000 on June 18, when outflows from exchanges peaked at around 68,000 BTC. As can be seen from the daily chart in the next section, the flagship cryptocurrency went on to rally 43.4% to $25,214 over the following month.
At the moment, the spike in BTC exchange outflows comes at a time when the BTC price has been chiefly oscillating within the $18,000 and $20,000 demand zone. Could BTC display a similar price action as the one previously witnessed after mid-June?
Bitcoin Needs To Reclaim The 100-SMA To Initiate A Recovery
As already mentioned, the favorite crypto has oscillated between two crucial levels, the $18,000 support zone and the $20,000 resistance area, since September 20. At the same time, buyers have been buying the dips near the support zone, with sellers taking profit on rallies to the resistance line.
The flattening moving averages and the appearance of a Doji stick on today’s candlestick, as well as the position of the Relative Strength Index (RSI) near the midline at 45, indicated an ongoing battle between buyers and sellers. If the immediate support at $9,000 fails to hold, Bitcoin’s price could decline to the $18,000 support line.

On the other hand, the RSI had started moving upward, showing that bulls were fighting to pull Bitcoin higher from the current levels. Therefore, a strong rebound off this level would imply that buyers were accumulating at lower levels. The bulls would then attempt to push the price above the 50-day Simple Moving Average (SMA) around $19,600 and later the $20,000 psychological level.
For Bitcoin to secure a sustained recovery, it will be required to overcome the barrier posed by the 100-day SMA sitting at $21,000. If this happens, the cryptocurrency price might rise to the local high of $22,800 before going for the $25,000 range high. Such a move would represent a 31.67% climb from the current level.
Market participants should keep a close watch on a break above or below the significant price points, which could spur a strong trending move.


