- XRP is showing strong bullish signals, with analyst Steph identifying three key patterns: a breakout above the daily EMA ribbons, a bullish MACD crossover, and a double-bottom breakout, all suggesting a potential major rally.
- If history repeats, XRP’s last similar breakout led to a 400% surge—which would place its next target around $13.25. The double-bottom pattern, if fully played out, could push XRP as high as $30+, representing a 1,032% gain from current levels.
- To confirm the uptrend, XRP must close above $2.80 on the daily chart. However, Bitcoin’s struggle below $100,000 has stalled altcoin momentum, meaning XRP’s breakout could depend on broader market recovery.
A well-known crypto analyst has flagged three major bullish signals for XRP across multiple timeframes—signs that could indicate a massive breakout is brewing.
XRP has been stuck in a consolidation phase around the $2 mark, mirroring broader market uncertainty. Bitcoin (BTC) is still battling to reclaim $100,000, leaving altcoins in limbo. But some analysts argue that XRP is gearing up for something big, especially once market sentiment flips bullish.
One of those analysts, Steph, has identified three distinct bullish setups that could send XRP skyrocketing.
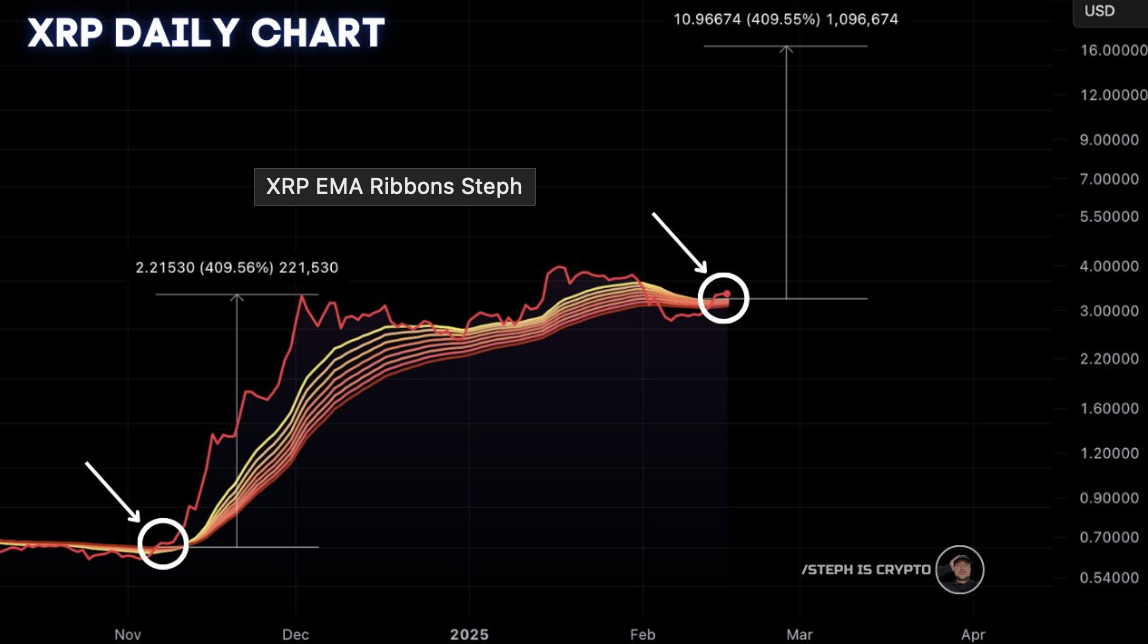
XRP Clears Daily EMA Ribbon – A Signal for a Major Breakout?
The first bullish sign is a breakout above the daily EMA ribbons—a crucial set of moving averages that traders rely on to spot trend shifts.
According to Steph, XRP just broke above this EMA cluster, a move that has historically preceded explosive runs. The last time this happened? November 2024, when XRP was trading at $0.54. Within weeks, the price soared over 400%, setting off a parabolic rally.
Now, Steph suggests a similar breakout is forming. If XRP follows the same trajectory, a 400% surge from current levels would place its price at $13.25.
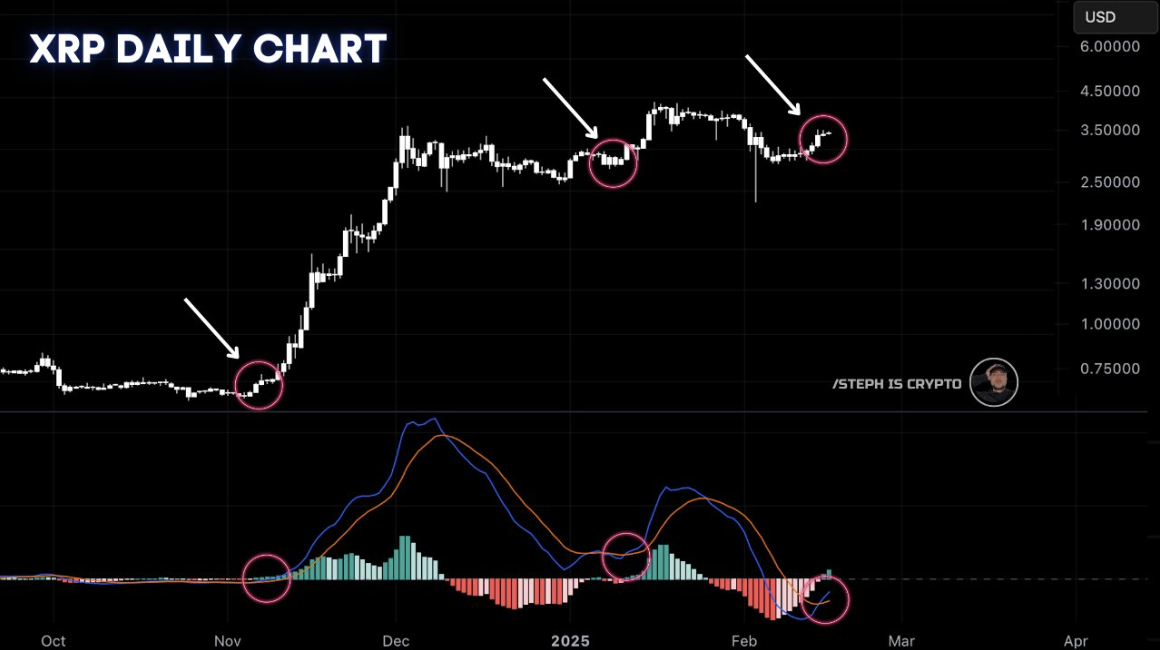
MACD Flashes Bullish Crossover – Momentum is Building
The second signal backing the bullish case is a MACD crossover on the daily timeframe.
For those unfamiliar, the Moving Average Convergence Divergence (MACD) indicator helps traders identify trend reversals. A bullish crossover occurs when the MACD line crosses above the signal line—a classic indication that momentum is shifting in favor of the bulls.
Steph confirms this crossover has just happened, strengthening the case for an extended uptrend.
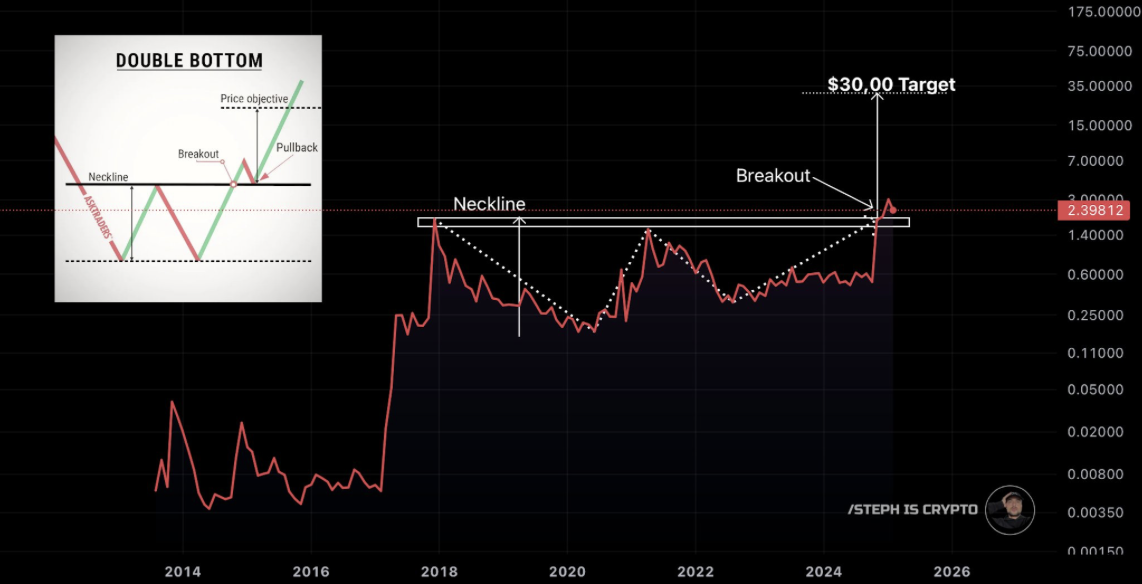
Double-Bottom Breakout – The “W” Formation That Could Send XRP Flying
The third and final indicator Steph highlights is a double-bottom breakout—a powerful bullish reversal pattern.
This structure, often called a “W pattern”, suggests bearish exhaustion and a transition to a strong upward move. For it to be valid, the price must break past the neckline, retest it, and continue higher—which XRP has already done.
The projected price target for this pattern? A jaw-dropping $30+.
Currently, XRP is trading at $2.65, meaning it would need to surge over 1,032% to hit this target.
What’s the Next Key Level for XRP?
While all three signals point bullish, Steph stresses that XRP must close above $2.80 on the daily chart to confirm the setup.
This level is crucial—if XRP can secure a strong close above it, it could act as a launchpad for further gains.
However, the broader market must cooperate. Bitcoin still struggles below $100K, which has kept many altcoins in a waiting game. But if BTC regains momentum, XRP’s long-awaited breakout could finally materialize.
The next few days could be critical.