
- Strong support holding: Cardano (ADA) has maintained stability above the crucial $0.81 to $0.67 support zone, which analysts believe is key to sustaining bullish momentum and preventing further declines.
- Indicators show mixed momentum: While the MACD has crossed above the signal line, suggesting potential for a price increase, weak momentum in the histogram and an RSI of 41.41 indicate neutral market conditions.
- Cautious optimism prevails: Social sentiment data reveals 22% positive, 70% neutral, and 8% negativesentiment, signaling that while the community is not overly bullish, there is guarded optimism for ADA’s potential breakout.
Cardano (ADA) has undergone a significant correction, forming key technical patterns on both high and low timeframes. Traders and analysts are now debating: will ADA recover or extend its decline further?
ADA Price Analysis: Correction and Potential Reversal
On the 4-hour chart, ADA has completed an ABC corrective wave, with Wave C bottoming at $0.51 on Feb. 3, just below the 0.786 Fibonacci retracement level. This could signal a major correction ending and a potential reversal forming.
Before the correction, ADA had surged in a five-wave rally, peaking at $1.31 on Dec. 3. Attempts to recover were halted near $0.81 (the 0.5 Fibonacci retracement), creating a critical resistance level.
Currently, ADA is trading within a descending channel, a pattern that hints at a possible breakout. If ADA can break above the $1.02-$1.13 zone, it could confirm a trend reversal. However, failure to do so may lead to extended consolidation or a further drop.
The RSI on the 4-hour chart has rebounded from oversold conditions, suggesting early signs of renewed bullish momentum.
source: Nikola Lazic/TradingView
Price Prediction: Elliott Wave Pattern Suggests Two Scenarios
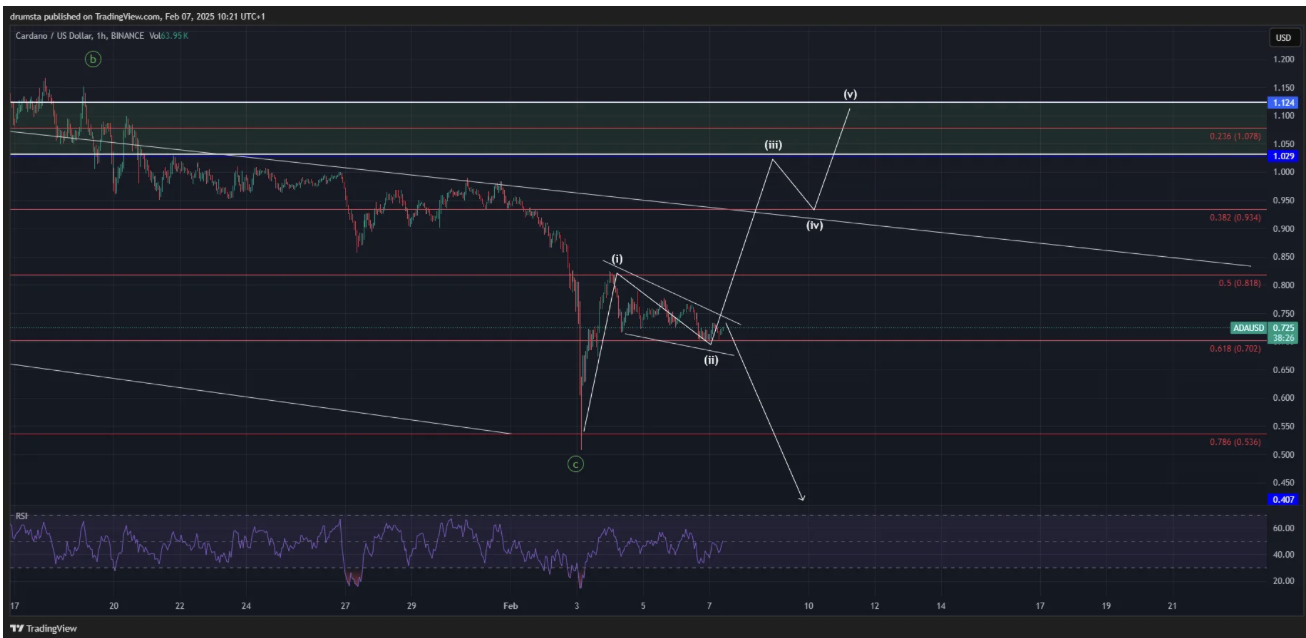
On the 1-hour chart, ADA appears to be forming a lower-degree Elliott Wave impulse structure. Price is currently in a corrective wave (ii), hovering around $0.72 after bouncing from $0.81. This setup often signals a coming upward breakout.
- Bullish Scenario: If ADA holds its current structure, it could initiate a wave (iii) surge, potentially pushing above $0.93 and targeting $1.02 and $1.12 in a wave (v) extension. These targets align with key Fibonacci resistance levels.
- Bearish Scenario: If ADA fails to break out of its falling wedge, it may dip to deeper support near $0.60-$0.65before any recovery attempt.
The RSI remains neutral, reinforcing that price action at key resistance and support zones will likely determine ADA’s next move.
Key Levels to Watch
- Immediate Resistance: $0.81 (0.5 Fibonacci retracement)
- Major Resistance: $1.02-$1.13 (0.236 Fibonacci retracement)
- Immediate Support: $0.702 (0.618 Fibonacci retracement)
- Critical Support: $0.536 (0.786 Fibonacci retracement)
- Short-Term Target: $1.12+ if wave (v) materializes
- Invalidation Zone: A break below $0.536 may signal further downside risks
Final Thoughts
Cardano’s price is approaching critical levels, with technical indicators showing mixed signals. Whether ADA can break resistance or slip further into consolidation depends on how it reacts to these key price points. Traders should closely monitor Fibonacci levels and RSI movement to gauge the next potential trend direction.