- Zcash (ZEC) hit a seven-year high of $449, breaking out from its long-term range between $25 and $300.
- Technicals show overbought conditions, but no bearish divergences yet—keeping short-term momentum alive.
- A weekly close below $300 could confirm a reversal, while holding above it might fuel another leg higher.
Zcash (ZEC) has been running laps around the rest of the crypto market lately. While most major coins are struggling to stay green, ZEC has done the opposite—smashing through resistance and hitting a seven-year high of $449. It’s a wild move for a coin that’s been quietly trading sideways for years.
Now, with barely any resistance above and momentum still strong, traders are wondering—does ZEC still have room to climb, or is this rally about to hit exhaustion? Let’s dig in.
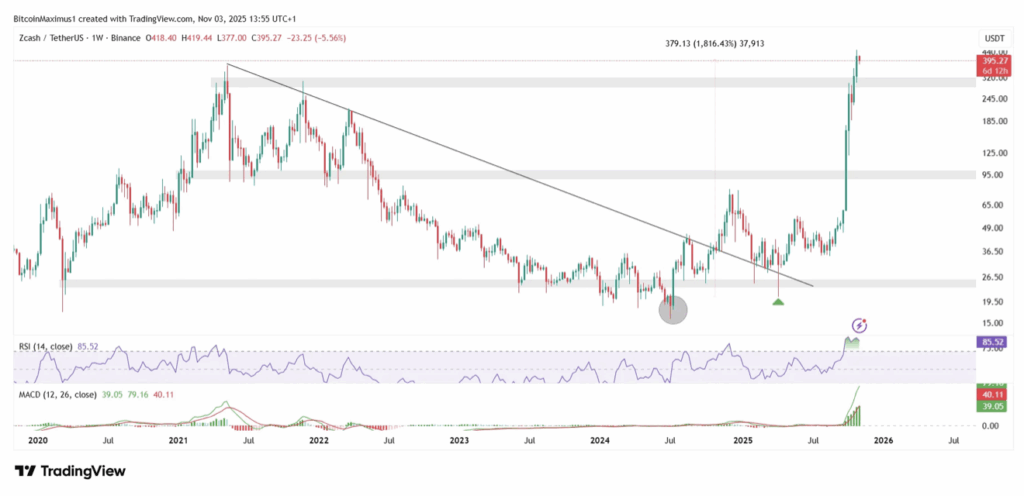
ZEC Price Blasts Past $300 Range
For more than five years, Zcash traded inside a wide range, bouncing between $25 and $300 without ever really breaking out. But in April 2025, something changed. After testing an old diagonal resistance, ZEC flipped the script and started rallying hard—really hard.
The move has been explosive: over 1,800% gains since the start of the run, officially breaking past that $300 ceiling for the first time since 2021. If this level now turns into support, ZEC could continue running higher into the end of the year.
However, if the price fails to hold that $300 zone, it could end up being a “fake-out” before a deeper pullback. For now, though, there’s no real sign of that happening. Momentum’s still holding up, even as traders grow cautious about overbought signals.
Technical Picture: Overheated but Not Broken
Looking at the technicals, both the RSI and MACD are flashing classic overbought readings. Normally that would signal a cooldown, but so far, there’s no major bearish divergence—meaning the rally could still have juice left.
Even so, analysts warn that ZEC might be entering a “final leg” phase of its current trend. Wave counts from analysts suggest the coin has completed an A-B-C corrective structure, where wave C may be marking a local top. The formation of a symmetrical triangle in wave B seems to support this count.
If this reading holds true, it hints that ZEC’s explosive move could soon shift into a slower correction period.
What Happens Next?
Zcash’s parabolic climb has been one of the most surprising stories of 2025. Breaking out of a multi-year range is no small feat, but the higher the rally goes, the steeper the risk of a sharp correction.
If ZEC holds above $300, the uptrend can still breathe and possibly push back toward $500 over time. But a weekly close below that level could flip the chart bearish fast, confirming the start of a larger retracement.
In short, Zcash looks powerful, but it’s also skating on thin ice. The trend’s hot, the momentum’s strong—but gravity eventually catches up, and when it does, things tend to move just as fast the other way.