
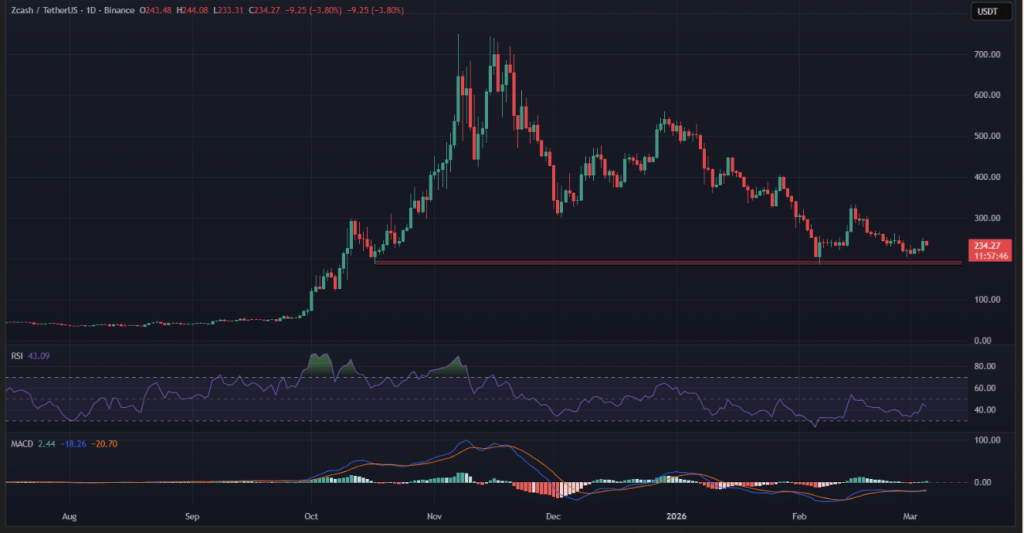
- Zcash stabilized near the $200 demand zone after months of selling pressure.
- Price is currently trapped between $200 support and $250 resistance.
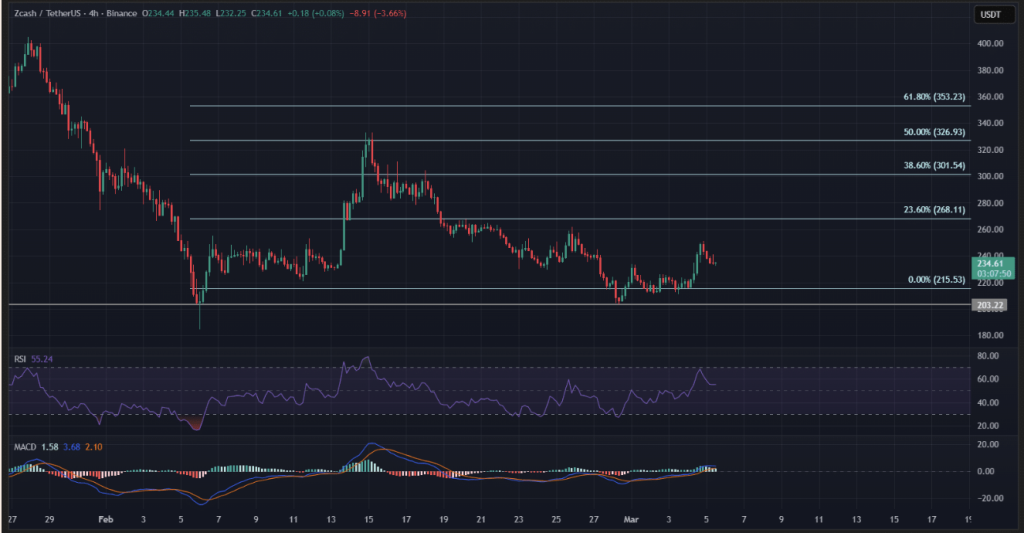
- A breakout above $240–$250 could push ZEC toward the $268 Fibonacci level, while losing $232 risks a drop to $215.
Zcash has been slowly stabilizing after the sharp decline from its earlier highs above $700. Over the past few months the trend had clearly favored sellers, with steady pressure dragging ZEC lower through December and January. That downward momentum, for a while at least, reinforced the broader bearish structure that had been forming across the chart.
But things started to shift once Zcash approached the $200 demand zone. Buyers stepped in there — repeatedly — absorbing sell pressure and preventing the market from sliding any deeper. The reaction from that area sparked a relief rebound of roughly 13%, nudging ZEC back upward toward the $250 resistance corridor.
Right now, price action is essentially squeezed between two important zones. Support near $200 has been holding the line, while resistance around $250 continues to cap the upside for now.
Momentum Indicators Show a Market in Transition
Momentum indicators tell a somewhat cautious story. The Relative Strength Index has been hovering around 43, which typically points to neutral territory rather than strong bullish momentum. In other words, buyers seem to be slowly rebuilding strength… but they haven’t fully taken control of the market yet.
At the same time, the MACD has begun showing early hints of stabilization after an extended bearish phase. The indicator isn’t flashing a clear reversal signal just yet, but the weakening downside momentum suggests the market may be trying to form a base.
Recently, Zcash pushed up toward $251, where horizontal resistance lines up with short-term moving averages. That confluence has made the area difficult to break through. As things stand, the market is effectively trapped between $200 support and the $250 resistance ceiling.
If buyers continue defending the lower zone, it could signal accumulation. And if price finally pushes through $250 with strength, that may kick off the next recovery phase.
Short-Term Structure Shows Gradual Recovery
Zooming into the lower timeframes reveals a clearer look at how this rebound has been developing. On the four-hour chart, Zcash defended a tighter support cluster between $232 and the Fibonacci baseline around $215. This region has acted like a cushion inside the broader accumulation zone forming above $200.
From that base, the market managed to bounce back toward the $234 area while approaching its next technical barrier. The next major checkpoint now sits at the 23.6% Fibonacci retracement level near $268, which could come into play if momentum keeps building.
Momentum indicators on the shorter timeframe are beginning to lean more positive as well. The RSI has climbed toward 55, hinting at rising buying pressure after the previous weakness. Meanwhile the MACD histogram continues narrowing as its signal lines creep closer to a potential bullish crossover.
Regulatory Clarity Adds a Boost to Sentiment
Another factor helping market sentiment is regulatory clarity around the project. The SEC recently closed its investigation into Zcash without taking enforcement action, removing a major uncertainty that had been hanging over the asset.
That development has helped improve confidence around ZEC, at least in the short term. Markets tend to react positively when regulatory pressure fades, and this appears to be contributing to the recent stabilization.
At the moment Zcash is testing the $240 threshold, which sits right between the key support and resistance zones. If the market manages sustained closes above this level, it could accelerate the relief rally toward $250 and possibly the $268 Fibonacci resistance.
However, the downside risk hasn’t disappeared. If the $232 support breaks, the chart could reopen a path toward the $215 level — which would place ZEC back near the base of its recent recovery range.