- Analyst Steph Is Crypto highlights a rare Stoch RSI signal hinting at a major XRP rally.
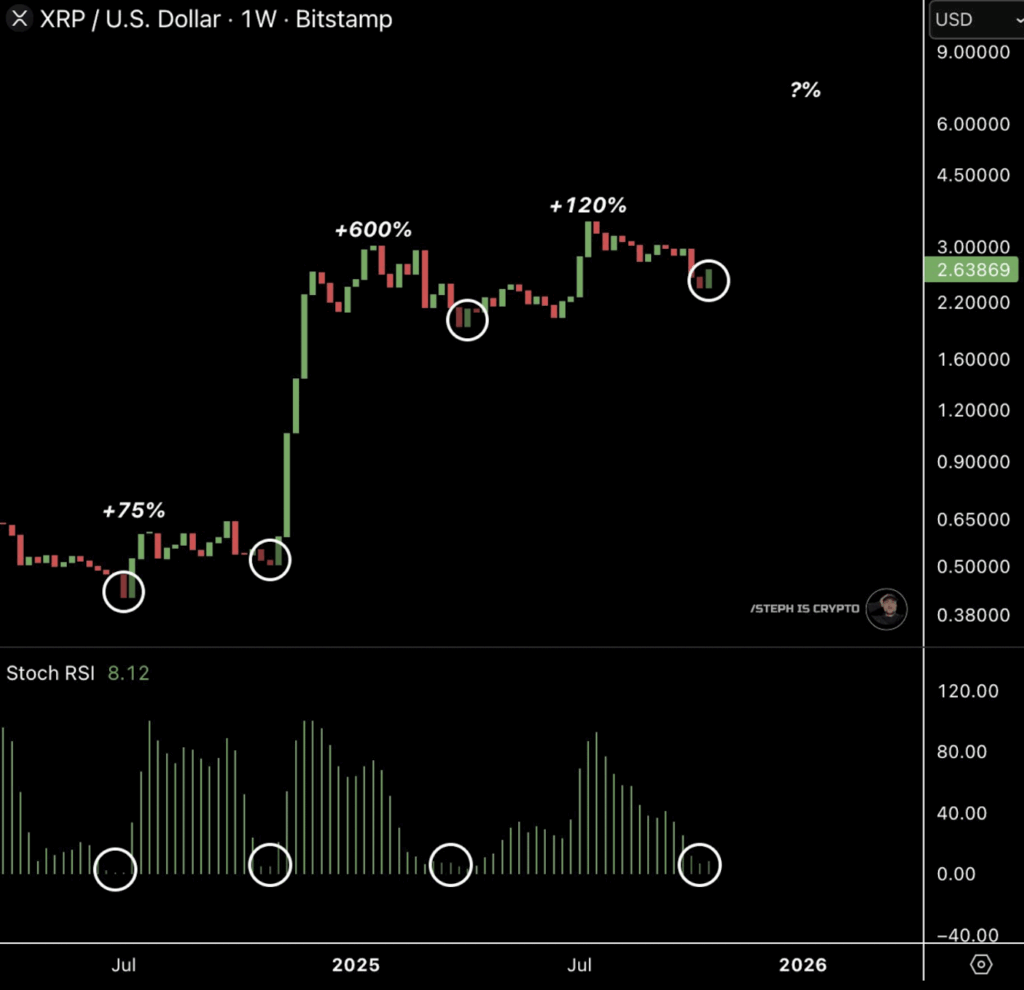
- Historical patterns show similar setups led to +75%, +600%, and +120% price surges.
- A breakout above $3.00 could confirm a new bullish phase with targets near $4.00.
Optimism is rippling through the XRP community again after a striking chart shared by analyst Steph Is Crypto went viral on X. The chart highlights a rare alignment of technical and historical signals that hasn’t appeared in months—and some traders are calling it one of the clearest buy signals for XRP this year. With the token hovering around $2.63, the setup is fueling whispers that a big move might be on the horizon.
A Familiar Pattern Appears
In his latest post, Steph broke down a weekly XRP/USD chart from Bitstamp, zooming in on one indicator that’s been freakishly accurate in the past—the Stochastic RSI. It’s a momentum oscillator that helps identify when a coin is either overbought or oversold. And right now, XRP’s Stoch RSI has plunged deep into the oversold zone… the same area that preceded some of its biggest historical rallies.
In previous cycles, when the Stoch RSI hit these low points, XRP exploded soon after—recording gains of roughly +75%, +600%, and +120%. Steph circled the current setup, showing how the pattern has returned almost perfectly. “It’s lining up again,” he said, hinting that another major upswing could be loading.
History Might Be Repeating Itself
What makes this chart so compelling is the consistency. Every time this indicator bottomed out in the past, XRP followed with an explosive rally not long after. The +600% move stands out in particular—it was a brutal reminder of how fast sentiment can flip once momentum catches.
Analysts tracking similar structures say XRP tends to move in rhythm, switching between long, quiet consolidation periods and short, powerful expansions. The Stoch RSI, they argue, acts as a kind of “cycle trigger.” Based on Steph’s chart, the signal flashing right now matches the ones that came just before previous uptrends—suggesting this could be the turning point traders have been waiting for.
Market Context Backs the Bullish Case
Outside of indicators, XRP’s broader structure looks solid. The coin has been holding above the $2.20 support, forming a higher-low pattern that usually signals strong buying pressure underneath. Liquidity remains stable, and across the crypto market, attention has been drifting back to large-cap altcoins—an environment where XRP often shines.
Steph also noted that XRP’s price rhythm appears to follow a cyclical cadence, with expansion phases repeating roughly every few months. Based on that spacing, the next impulse wave might already be forming quietly beneath the surface. If the cycle plays out again, the timing couldn’t be better for bulls.
What Could Come Next
Of course, no indicator guarantees the future. Still, if the pattern continues and XRP pushes decisively above its short-term resistance around $2.80–$3.00, it could mark the start of a new leg higher. Analysts point to $4 as the next key target—one that’s been tested before during past peaks.
On-chain data and liquidity growth will be key confirming factors. If transactions and active wallets pick up alongside price, it would strengthen the case for a genuine breakout instead of a short-term bounce.
Steph’s analysis might end up being one of the most significant technical signals for XRP in 2025. With historical precision, rising support, and a deeply oversold oscillator all lining up, XRP looks to be approaching a pivotal moment. As always, confirmation is key—but for now, the chart’s message is loud and clear: the setup resembles the calm before something big.