- XRP has a history of sharp rallies followed by deep corrections, forming long-term patterns
- Current price action shows weak momentum within a broader downtrend
- An ascending triangle suggests a breakout is possible if resistance levels are cleared
XRP’s price history isn’t exactly smooth, it moves in waves, sharp ones. Back in 2018, the token hit a major peak before collapsing nearly 96%, a classic blow-off top that wiped out most of the gains just as quickly as they came. It was brutal, honestly, but not unusual in crypto.
After that crash, something quieter happened. XRP began forming a base, a long stretch of consolidation where stronger hands started accumulating while weaker ones had already exited. According to analyst JD, this phase laid the groundwork for future moves, even if it didn’t look exciting at the time.
Then came the 2020–2021 period. XRP attempted another rally, but it couldn’t quite reclaim its previous all-time high, and eventually dropped again, this time around 85%. Still, there was a subtle shift, price action started following a rising trendline, hinting that the market structure was slowly improving.
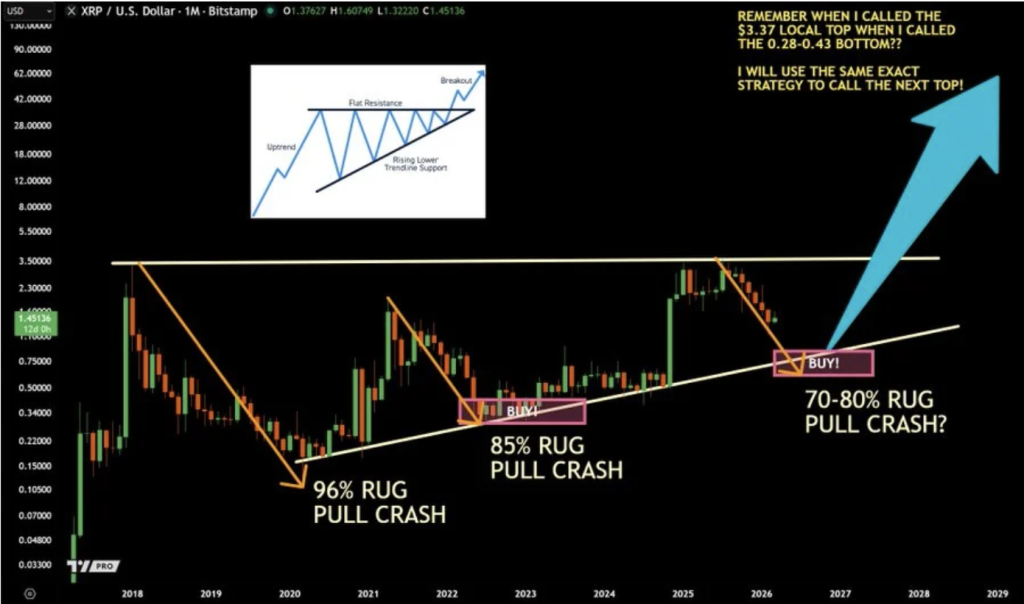
A Slow Shift Toward Higher Lows
One of the more interesting developments over time has been how XRP’s dips have changed. They’re getting smaller. Each pullback isn’t as deep as the last, and more importantly, each low is slightly higher than the one before it. That kind of pattern usually points to a strengthening trend, even if it’s not obvious right away.
It’s not explosive growth, not yet anyway. But it suggests accumulation is still happening in the background, gradually building pressure. Sometimes that’s how larger moves begin, quietly, with most people not really paying attention.
Still, the market doesn’t move in a straight line. And right now, XRP seems a bit stuck.
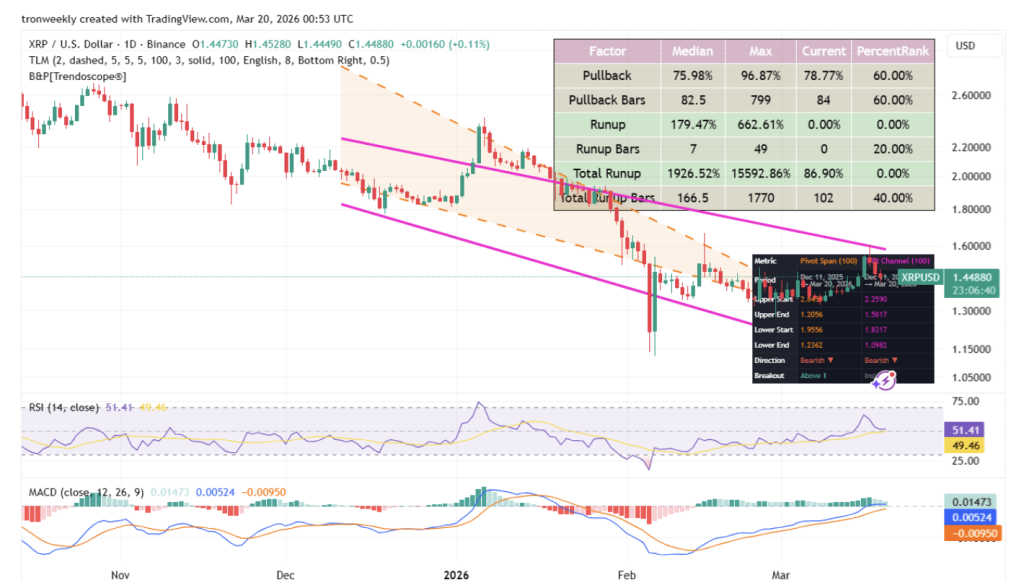
Current Price Action Feels… Weak
At the moment, XRP is trading within a broader downtrend, and it shows. The chart structure is forming lower highs and lower lows, which is usually a clear signal that sellers are still in control. Even though price has bounced from its February lows, it hasn’t managed to break past the midpoint of its channel.
That’s a bit concerning for bulls. It suggests that buying pressure isn’t strong enough, at least not yet, to flip the trend. Momentum indicators aren’t helping much either, the RSI is sitting in the low 50s, which is basically neutral, while the MACD is hovering close to zero with only a slight uptick.
In simple terms, the current move looks more like a weak rally inside a larger bearish structure. Not exactly the kind of setup that sparks confidence, but also not a complete breakdown.
A Breakout Could Still Change Everything
Despite the sluggish momentum, there’s still a setup forming that traders are watching closely. XRP appears to be building an ascending triangle, a pattern where resistance stays relatively flat while support gradually rises underneath. It’s the kind of structure that can lead to sharp breakouts… if buyers step in with enough force.
Key resistance sits around the $1.50 to $1.60 range, and that’s likely where sellers will defend aggressively. If XRP can break through that zone with strong volume, the move upward could accelerate pretty quickly. That’s usually how these patterns resolve.
On the flip side, support levels below remain critical. If price breaks down instead, especially below the lower boundary of the channel, it could trigger another sharp drop, similar to what we saw earlier this year.
For now, XRP is in a waiting phase. The structure is there, the potential is there… but the confirmation? Not yet.