- XRP’s high-timeframe momentum has fully compressed, a rare signal that previously marked the end of major downtrends
- Long-term chart patterns are closely mirroring the structure seen before XRP’s last historic breakout
- While price remains cautious, downside pressure appears limited as accumulation quietly replaces distribution
XRP has drifted back into a price zone that feels strangely familiar to long-time traders. It’s the same kind of environment that existed before its last historic breakout, when interest was low, momentum was flat, and patience mattered more than hype. Right now, selling pressure looks tired, not aggressive, and longer-term holders appear to be quietly soaking up supply. Price action is still cautious, sure, but the structure underneath is starting to raise eyebrows again.
A Rare Momentum Reset on Higher Timeframes
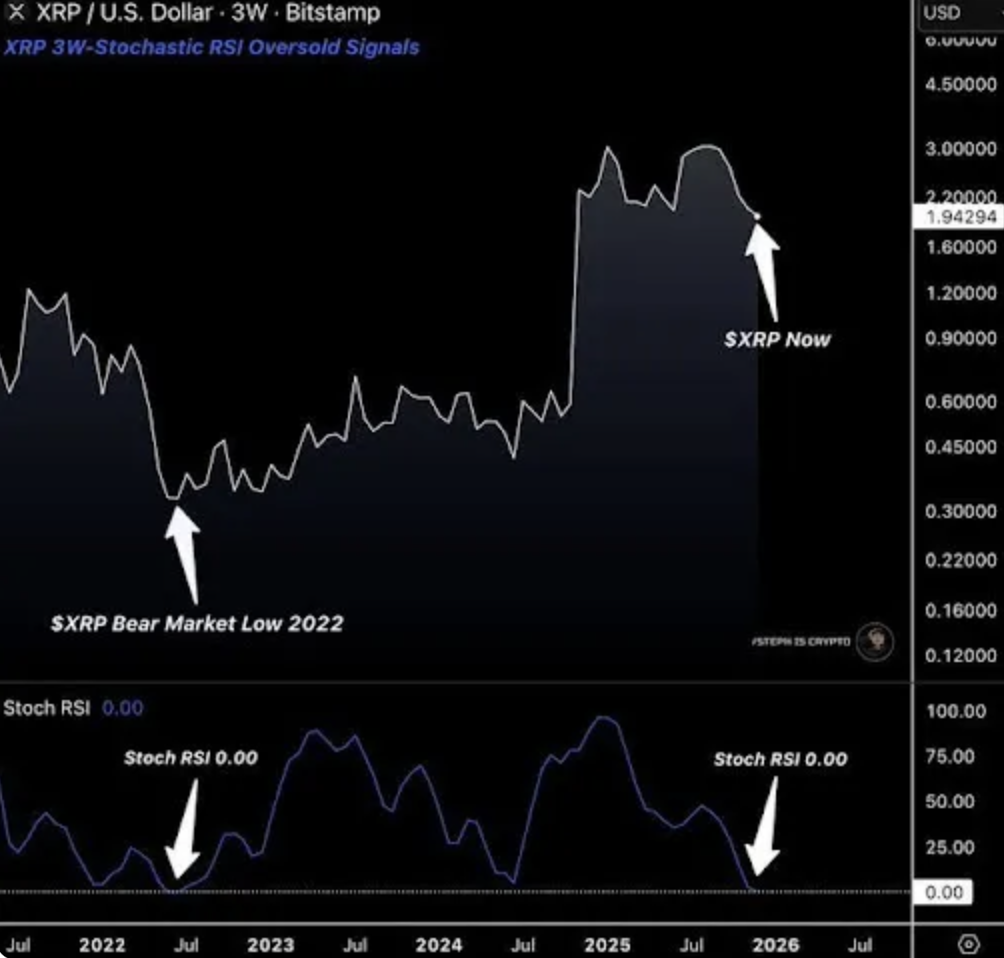
One of the more interesting developments is happening far above the short-term noise. On the 3-week chart, analyst Steph is Crypto pointed out that XRP’s Stochastic RSI has dropped all the way to 0.00. That’s not just oversold, that’s total compression. It’s a level the indicator almost never reaches.
In fact, this exact signal has only shown up once before in XRP’s history, during the deepest part of the 2022 bear market. When momentum indicators fully flatten like this, it usually means sellers have spent their energy. There’s no urgency left, just exhaustion. That doesn’t mean price instantly rips higher, and it never has. What it tends to signal instead is the start of a long, quiet phase where smart money builds positions while the broader market looks elsewhere.
Back then, XRP didn’t explode upward right away. It stabilized, moved sideways, and slowly formed a base. Only later did that groundwork turn into a powerful upside move. Seeing the same condition form again suggests downside risk is becoming limited at current levels. It also hints that the market may be shifting away from distribution and toward strategic accumulation, even if it doesn’t look exciting yet.
A Familiar Rhythm Returns to XRP’s Long-Term Structure
Adding to that picture, analysts at Altcoin Pioneers have flagged a fractal pattern on XRP’s longer-term charts that closely resembles its 2016–2017 cycle. On the 3-day timeframe, the similarities are hard to ignore. Both periods feature a long ABC corrective structure, drawn-out and frustrating, followed by a sharp breakout once the correction fully resolved.
In the earlier cycle, XRP spent months grinding through that final leg lower before momentum flipped decisively. The current structure, spanning 2024 into 2025 and now early 2026, appears to be tracing a very similar path. The final C-wave seems to be pressing into the $1.87 area, slightly faster than last time, but structurally familiar.
If that fractal continues to play out, XRP could be nearing the end of its shakeout phase. Historically, this is the stage where weaker hands give up and long-term participants step in quietly. Nothing dramatic happens at first. Then, suddenly, it does. Traders who lived through the last full XRP cycle know this rhythm well, it never announces itself loudly.
For now, XRP remains subdued, trading near $1.86 with no rush in either direction. But beneath that calm surface, momentum compression, historical structure, and long-term holder behavior are lining up in a way that doesn’t happen often. Whether the broader market cooperates is still the big unknown, but structurally, XRP is starting to look less like it’s breaking down, and more like it’s setting the stage.