XRP technical price analysis shows that the crypto asset shattered a significant resistance level at $0.4684 to launch a bullish recovery. The cross-border remittances token climbed 17% from the said level to a high of $0.5480 on Sunday.
XRP appears to be preparing for a sustained upward movement in the short term. What are the levels to look out for?
XRP Needs To Reclaim $0.55 To Sustain The Uptrend
At the time of writing, XRP was trading at $0.533, up 4.61% daily, with a 24-hour trading volume of $1.85 million. The market capitalization was at $26.6 billion after rising 4.67% over the same period. The altcoin started growing on October 3 as the “XRP Army” remained hopeful that the token could record an impressive performance in 2022. They kept their figures crossed that Ripple Labs would come out victorious in the legal battle U.S. Securities and Exchange Commission (SEC).
Ripple is currently one of the best-performing cryptocurrencies in the market and has rallied over 20% over the last week. The largest cryptocurrency by market cap, Bitcoin, is only up 1.79% over the previous seven days. This rise is 2.72% for second-placed Ethereum, and Binance Coin (BNB) is down 2.22% over the same time frame.
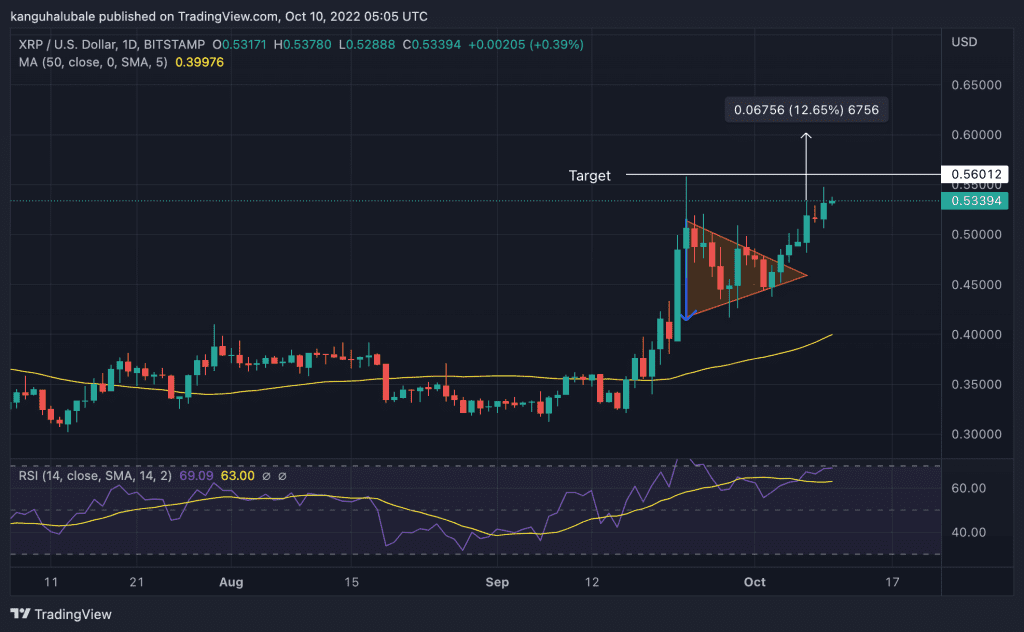
After setting a swing high at $0.56 on September 23, the international payments token has been recording a series of lower and higher lows, leading to the appearance of a symmetrical triangle on the daily chart. XRP price broke through the descending trendline of the chart pattern at $0.4684 on October 4 and moved toward the next resistance level at $0.55.
Note that a daily candlestick close above the $0.55 psychological level would suggest strength amongst buyers who could be bolstered to push the price toward the optimistic target of the prevailing chart at $0.560. Beyond this level, the altcoin may run to $0.60 in the short term. Such a move would represent a 12% upward move from the current price.

XRP’s bullish outlook was validated by the upward movement of the 50-day simple moving average (SMA), which currently sits at $0.40. This indicates that the buyers have returned to the scene and are determined to increase the price.
Also supporting the positive outlook was the upward-facing relative strength index (RSI). Its position at 69 in the positive region suggested that XRP was firmly under the control of buyers. Note that XRP’s upward movement would gain more traction once the RSI crosses the 70 mark into the overbought zone.
On the downside, the appearance of the Doji candlestick at the end of the chart pointed to a fierce battle between the bulls and the bears. Should the bears prevail, they could pull the price down from the current levels toward the $0.50 psychological level. Such a move would take the price back into the price range defined by the symmetrical triangle. Investors could expect the price to consolidate here before staging a comeback.
In highly bearish cases, XRP may drop further to tag the $0.45 psychological level outside the prevailing chart pattern. Lower than that, a move toward the $0.417 swing low would be the next logical move.


