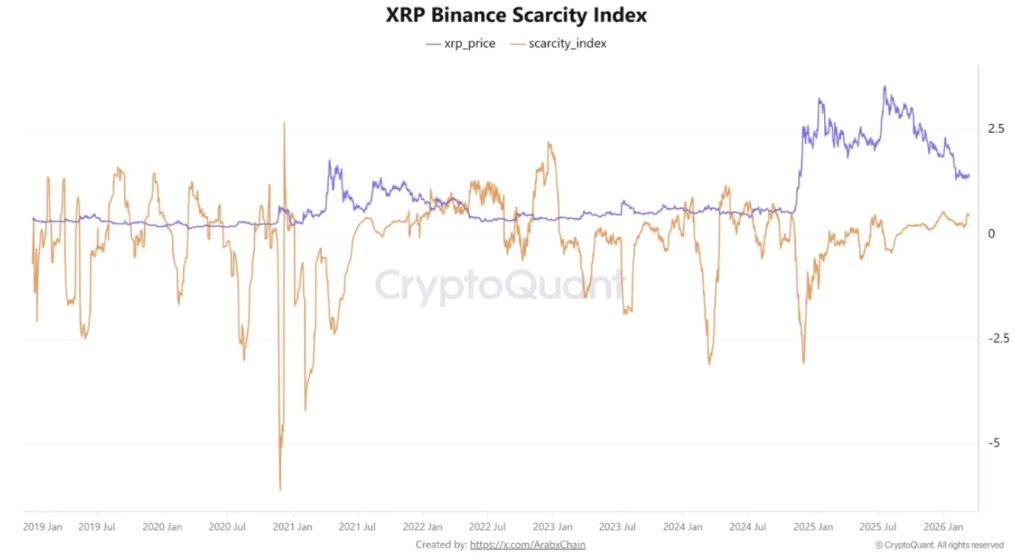
- XRP’s Binance Scarcity Index turned positive, signaling tightening supply on the exchange.
- Derivatives activity remains high with $2.26 billion in futures trading volume.
- Technical charts show a compression pattern that could lead to a major breakout or breakdown.
XRP’s supply situation on Binance is starting to shift, and traders are paying attention. The XRP Binance Scarcity Index recently turned positive, which usually signals that the amount of XRP sitting on the exchange is tightening slightly. When supply shrinks while interest stays high, even small bursts of buying can push price around more than usual.
CryptoQuant analyst Arab Chain noted on March 15 that the index climbed to roughly 0.48, a level that suggests moderate scarcity compared to historical readings. Meanwhile, market data shows XRP trading near $1.42, reflecting a small daily gain of about 0.57%. Not a huge move, but enough to keep traders watching.
Looking at intraday charts from TradingView, XRP has been moving inside a fairly tight range between $1.405 and $1.425. That kind of sideways action often points to consolidation. In simple terms, the market appears to be pausing… waiting for the next major catalyst.
Binance Scarcity Index Points to Declining Exchange Supply
According to Arab Chain, previous increases in the Binance XRP Scarcity Index have usually appeared alongside declining exchange reserves. When that happens, it often means investors are withdrawing tokens into private wallets rather than leaving them on exchanges.
Less supply on exchanges naturally changes market dynamics. If fewer tokens are available for immediate sale, buying pressure can move prices more quickly. Even moderate demand can sometimes produce sharper price reactions.
The opposite situation also happens from time to time. Historically, the index has dropped into deeply negative territory during periods when large amounts of XRP flow into exchanges.
Those inflows increase the pool of tokens available to sell. Naturally, that tends to coincide with heavier selling pressure as traders prepare to offload holdings. The scarcity index, in a way, acts like a small window into how liquidity is shifting inside the market.
Derivatives Markets Show Heavy Trader Activity
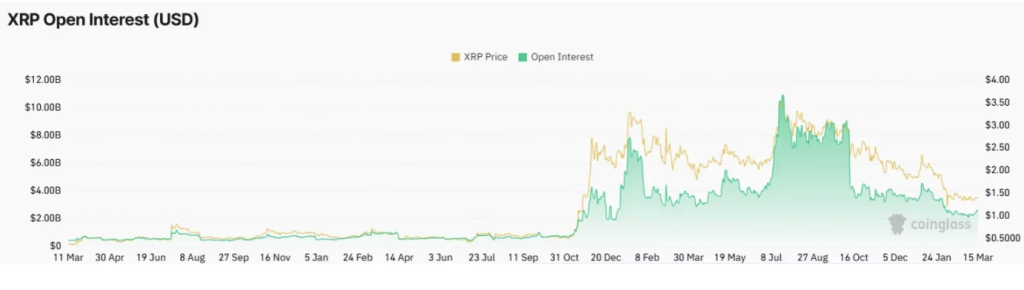
While exchange supply tightens, derivatives activity around XRP remains extremely active. Data from CoinGlass suggests traders are positioning themselves ahead of what many expect could be a larger move.
Over the past 24 hours, XRP futures trading volume reached roughly $2.26 billion. That figure towers over the spot trading volume, which currently sits around $377 million according to TradingView.
Open interest has also ticked higher. Futures open interest increased by about 1.09%, bringing the total to around $2.59 billion. When open interest rises during a consolidation phase, it often means traders are building leveraged positions while waiting for a breakout.
Interestingly, the long-to-short ratio across derivatives markets currently sits near 1.00. That essentially means bullish and bearish positions are balanced. The market, at least for now, seems undecided about which direction comes next.
Technical Structure Shows Compression Pattern
Beyond supply metrics and derivatives data, technical analysts are watching XRP’s long-term structure closely. Crypto analyst EGRAG CRYPTO pointed out that the token is currently interacting with its 200-week exponential moving average, a level that has historically acted as a major macro pivot point.
Recently, XRP briefly dipped into that EMA level before bouncing back above it. During that process, the weekly chart formed what appears to be a compression pattern—specifically a triangular structure tightening over time.
These kinds of compression patterns often suggest the market is absorbing selling pressure. Price gets squeezed between support and resistance until, eventually, it breaks one way or the other.
EGRAG outlined two possible outcomes from here. The first scenario involves a liquidity sweep below the triangle, potentially pushing XRP down into the $0.93 to $0.80 region before a rebound begins.
The second scenario is more bullish. If XRP breaks upward from the triangle and momentum shifts in favor of buyers, the next price targets could land somewhere between $2.20 and $3.20.
Why This Setup Matters for XRP
Taken together, several signals suggest the XRP market might be approaching an inflection point. Exchange supply appears to be tightening slightly, derivatives positioning remains elevated, and the technical structure shows a classic compression pattern.
When those conditions align, the market often prepares for a larger move—though the direction isn’t always obvious beforehand.
For now, XRP continues drifting within its consolidation range while traders monitor key levels and liquidity flows. Eventually the market will choose a direction. The only question is when.