
- XRP rallied to $1.50 within a descending broadening triangle before facing strong rejection and a 10% pullback.
- The four-hour structure remains intact, suggesting continued range-bound volatility and rotational moves.
- On the weekly chart, XRP trades below major EMAs with weak momentum signals, keeping the broader trend bearish.
XRP slipped back into high-volatility mode this week, validating a descending broadening triangle that had been forming on the four-hour chart. The structure developed through a series of lower highs, paired with an expanding lower boundary — a pattern that signals widening price swings rather than calm consolidation. Alpha Crypto Signal pointed out the tightening compression phase, where traders were essentially waiting… watching… for the breakout.
That breakout came quickly. XRP jumped nearly 10%, charging toward the clearly defined resistance zone around $1.50. The move was precise, almost too precise, tagging the upper boundary of the formation and completing what looked like a textbook range expansion.
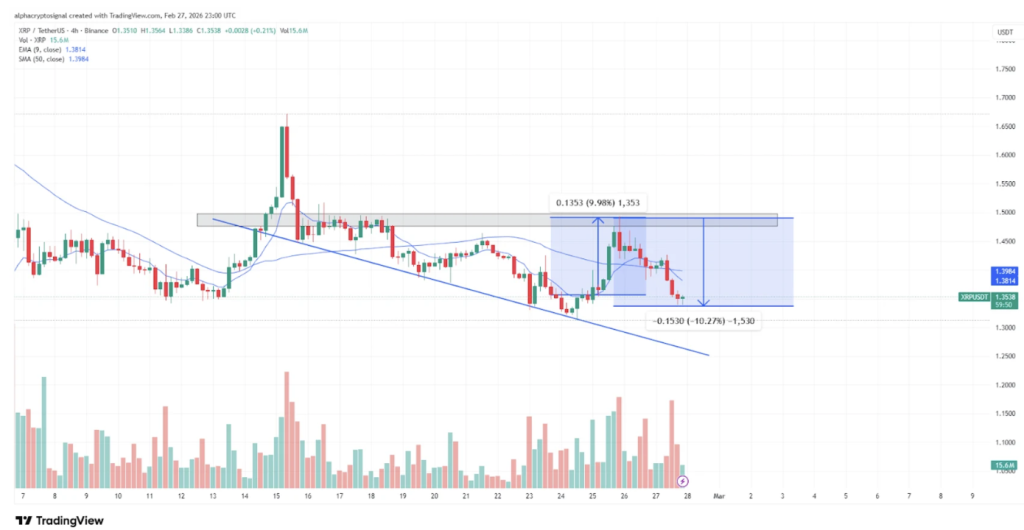
$1.50 Rejection Shifts Momentum
But resistance held. Liquidity stacked near $1.50 attracted selling pressure almost immediately, and the rally stalled out. Bulls had energy, sure, but not enough sustained force to flip resistance into support.
The rejection triggered a sharp reversal. XRP dropped more than 10% from its local high, sliding back toward descending trendline support. Momentum indicators strengthened on the bearish side during the pullback, reinforcing that sellers had regained short-term control. Importantly, though, the broader triangle structure remains intact — price is still respecting both boundaries.
As long as those lines continue to hold, rotational price action is likely. Volatility expands. Contracts. Expands again. For active traders, that environment can create opportunity. For long-term holders, it’s mostly just noise.
Weekly Chart Signals Broader Downtrend
Zooming out to the weekly timeframe, the picture turns heavier. XRP peaked above $3.00 in late 2025 and has trended lower since. Now trading near $1.28, the asset sits below the 20, 50, and 100 EMAs — a clear sign that bears maintain control.
The 200 EMA around $1.41 has become a firm resistance level. Momentum indicators add to the cautious tone. RSI is hovering near 30, technically in oversold territory but lacking strong bullish divergence. Meanwhile, MACD remains in negative territory with expanding histogram bars, despite showing a minor bullish crossover.
A temporary relief bounce wouldn’t be surprising — markets often snap back when stretched. But unless XRP reclaims key moving averages and breaks above resistance with conviction, the broader weekly trend continues to lean bearish.