- XRP’s chart patterns look bullish, with a falling wedge targeting $3.20 and an ascending triangle aiming for $3.50 if resistance levels are cleared.
- XRP/BTC shows a strong bullish divergence, suggesting seller exhaustion and potential for a 70% rally that aligns with XRP hitting $3.
- Buyers are dominating the market again, as seen in the positive spot taker CVD, signaling steady accumulation despite recent price dips.
XRP’s flashing signals all over the place, and some of them are starting to line up. The charts are showing promise — not wild hype, but solid setups that suggest we might be heading toward $3 sometime this month. From falling wedges to triangles and bullish divergences, the technical case is stacking up. It’s not a sure bet, but the groundwork’s definitely there.
First up — the falling wedge. On the weekly chart, XRP is pushing against resistance around $2.43. If it manages to close above that, the target jumps to $3.20 — which would be a 45% move from current prices. That wedge isn’t some random pattern either. It’s one of those classic bullish setups, and XRP is bouncing along all its major moving averages, which is usually a green light for trend-followers. Not bad at all.
Triangle Patterns and BTC Pair Fuel More Optimism
Then there’s the ascending triangle. On the daily chart, XRP’s been working its way up since a major bounce from $1.61 in April — that was a 70% recovery, by the way. Right now, it’s pressing against $2.60, and a break above that level sets a target of $3.50. That’s a 60% upside, and triangles like this often end with a big move — up or down, but in this case, all signs point upward.
And it’s not just dollar charts. The XRP/BTC pair is giving off some bullish divergence vibes. Price has been falling for years — not great — but RSI has been climbing in the background. That split usually means sellers are getting tired, and buyers are quietly gaining ground. If XRP breaks the 0.00003375 BTC wall, it could explode to 0.00003609 BTC, which, if it follows the pattern, lines up with XRP touching $3 again. Coincidence? Maybe not.
Buyers Are Still Here, Even After the Dip
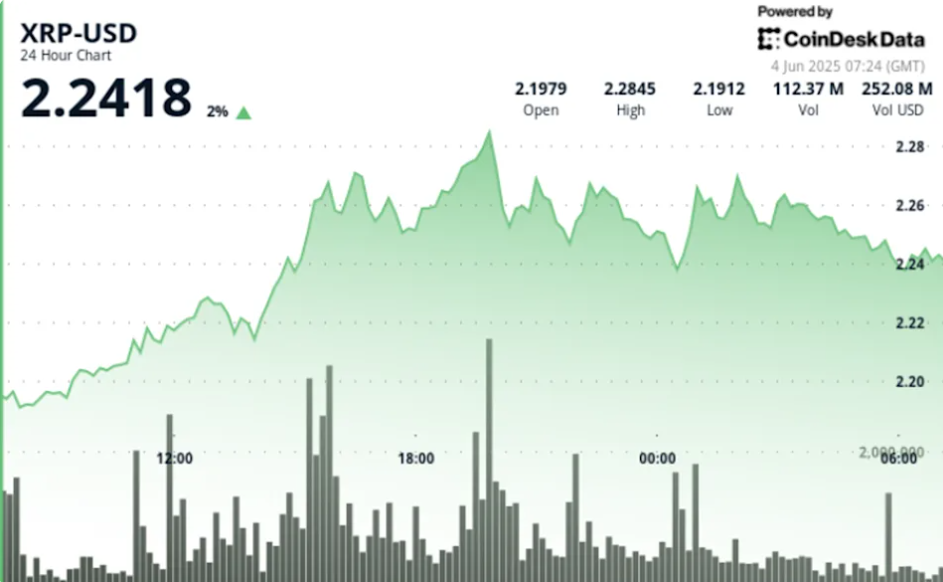
Now for something a little different — CVD. That’s cumulative volume delta, if you’re wondering. It tracks the difference between buy and sell orders. Right now? It’s green. That means buyers are still active — placing more orders than sellers — even after the price fell 17% from its May highs. That kind of behavior usually shows quiet confidence, like they’re loading up while things are still cheap.
Back in March, things were bleak — sellers ran the show. XRP even dropped to $1.61. But since mid-May, that tide’s turned. CVD flipped positive around May 19, and hasn’t really looked back. That kind of persistent buying? It often leads to rebounds. If this holds, and buyers stay stubborn, there’s a solid chance we’ll see a fresh rally kick off — maybe all the way to $3, maybe more. Just don’t blink.