- XRP remains stuck in consolidation, bouncing between $2.30 and $2.50, with buying pressure present but not strong enough to push a breakout.
- Key resistance at $2.50 is being tested repeatedly, while liquidation clusters at $2.26 and $2.54 suggest potential volatility ahead, giving swing traders key levels to watch.
- If XRP breaks above $2.50–$2.70, an uptrend could begin, but failure to do so may lead to further downside, with bears still holding some control over the market.
Just a few days ago, AMBCrypto analyzed the possibility of a 27% surge for Ripple (XRP)—but things didn’t quite go that way. On-chain signals weren’t too encouraging. Whale activity pointed toward selling pressure, while XRP/BTC price action suggested a period of sideways movement was more likely than an explosive rally.
Since then? XRP has been stuck in consolidation mode. The price is clinging to the $2.29 retracement level, defending it like a last stronghold. But if there’s any real hope for a breakout, a decisive move past $2.50 is what bulls need to set their sights on.
XRP Bulls Have One Key Advantage in the Fight for $2.50
XRP Daily Chart Analysis
A look at the trading volume over the past few months suggests something interesting—buyers are still showing up, even if momentum has slowed. This is reflected in the On-Balance Volume (OBV), which, despite some dips, has trended upward overall.
Even though XRP lost the $2.95 support and the broader trend leans bearish, all hope isn’t lost. The Relative Strength Index (RSI) remains below neutral 50, meaning bears are still in control—but XRP has tested $2.50 resistance four times in the past week. That’s a sign that sellers might be losing their grip.
Range-Bound, But for How Long?
XRP 4-Hour Chart Analysis
Zooming into the 4-hour timeframe, XRP has been bouncing between $2.30 and $2.50, forming a well-defined range. The OBV on this timeframe shows a slight downtrend, signaling some distribution. Volume has also been lowercompared to early February’s wild volatility.
So, what does that mean? The market is in wait-and-see mode. Neither side is making aggressive moves—yet.
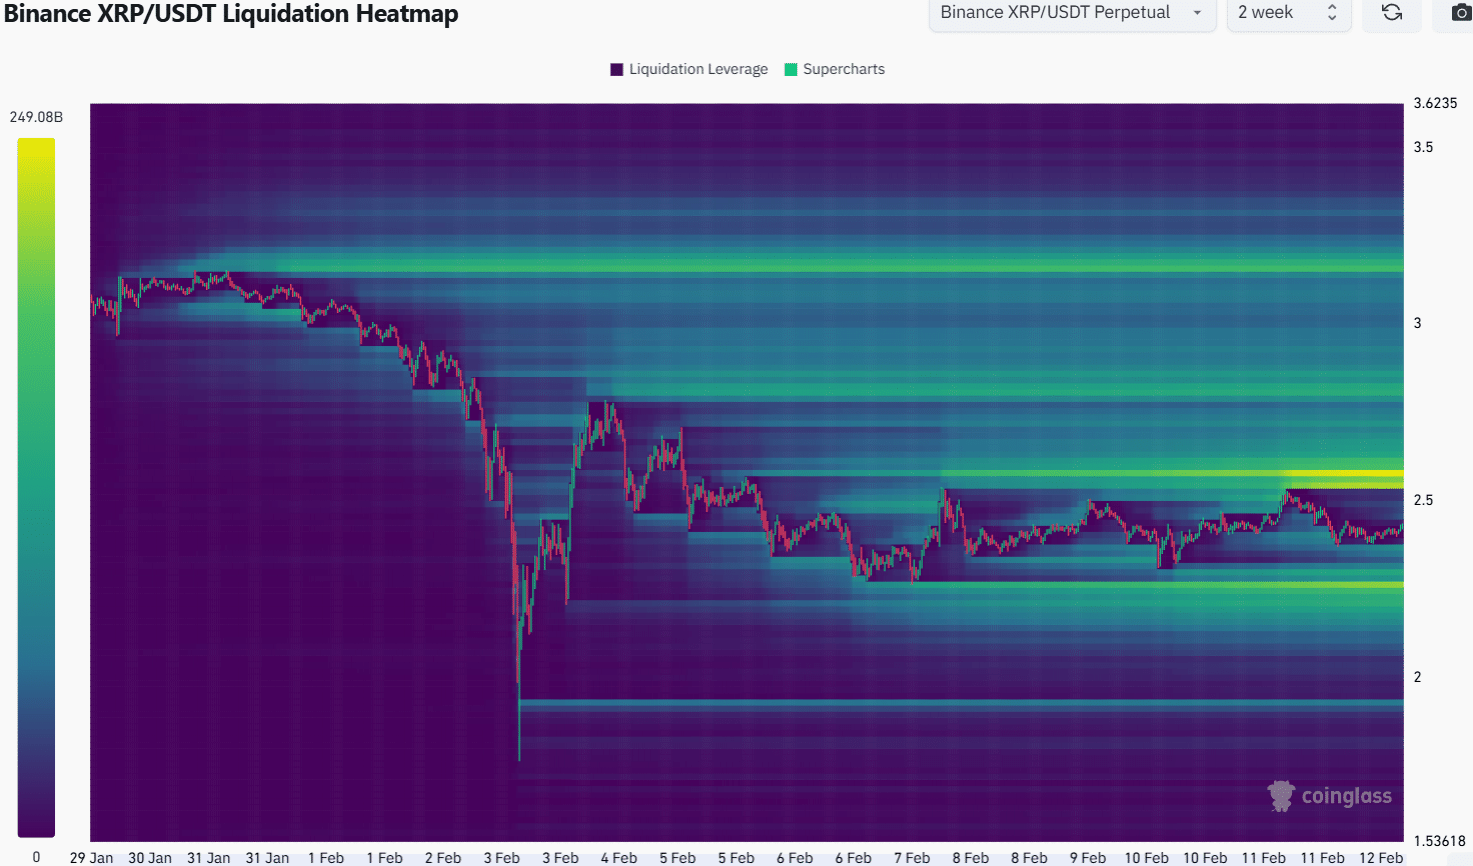
Liquidation Heatmap Holds the Key
The liquidation heatmap adds another layer of insight. Right now, two key liquidation clusters have formed—one near $2.26, the other at $2.54. These levels sit just outside the current range, making them crucial battlegrounds.
For swing traders, this is gold. These levels often trigger reversals, so keeping an eye on lower timeframes for potential entries could be a solid strategy.
Final Verdict: Breakout or Breakdown?
The longer-term outlook still leans bullish—XRP has managed to hold the 78.6% Fibonacci retracement level, a critical sign of strength. If the price can break past $2.50–$2.70, that would mark the beginning of a new uptrend.
But if the resistance holds strong? Another leg down might be in store. One thing is clear—XRP is at a crossroads, and the next move could define its trend for weeks to come.