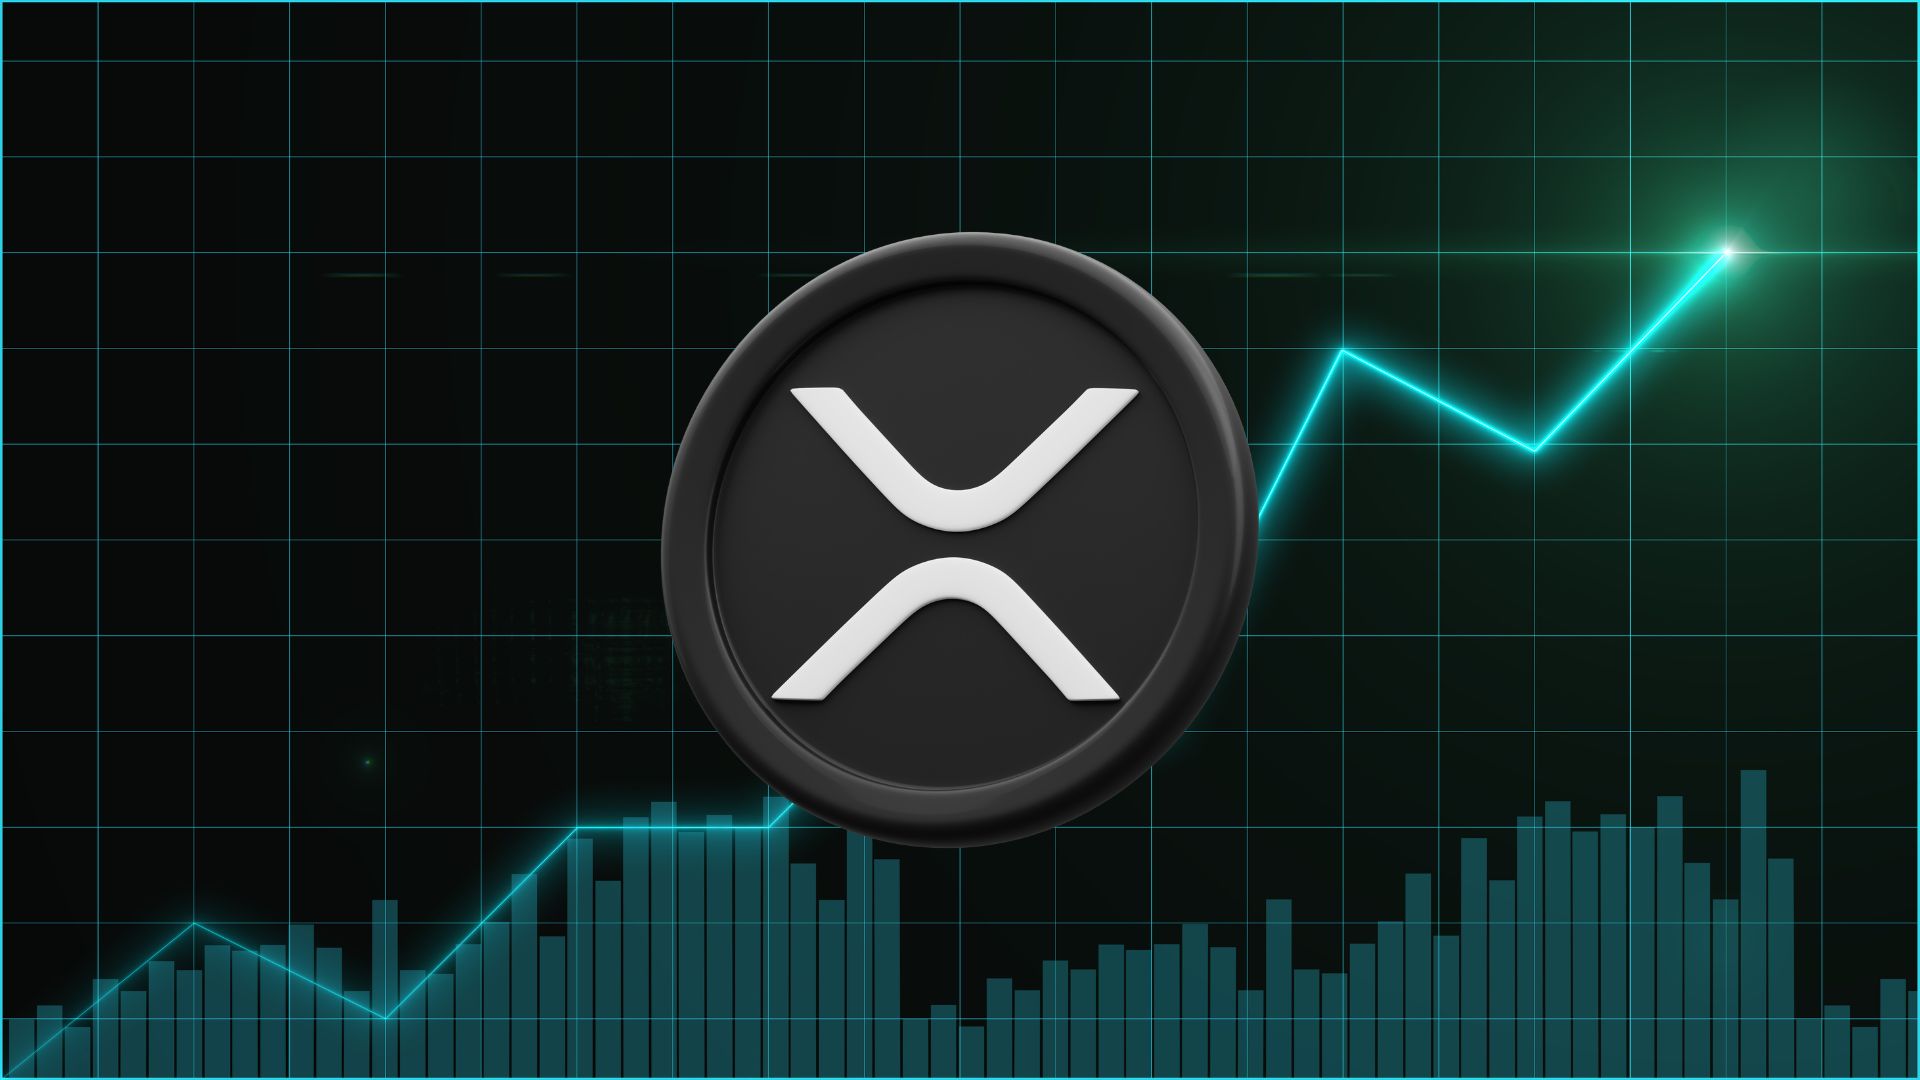
- Analysts predict XRP could hit $4–$4.50 in April, citing strong technical patterns like a wave 4 correction and ascending triangle setup.
- Bullish signals are forming, with RSI divergence and key support at $2.36 holding firm, suggesting momentum might be shifting in favor of buyers.
- Key levels to watch include resistance at $2.70 and continuation targets at $3.05, $3.40, and potentially a retest of the $3.80 all-time high.
A popular crypto analyst who goes by Prophecy Trading thinks XRP might be gearing up for something big — like new all-time highs kinda big. Based on his latest breakdown, XRP could pull back just a little more before launching a massive rally that could send it flying to $4… or even higher.
XRP’s Chart Looks Familiar… In a Bullish Way
In a post on TradingView, Prophecy pointed out that XRP’s chart is showing a wave 4 corrective pattern — something that often shows up right before a big rally, at least according to Elliott Wave theory. He says the structure kinda mirrors XRP’s price movement from back in 2017, just before it went on that wild run to its previous ATH.
Right now, instead of falling apart, XRP is mostly just consolidating — not breaking down, just kinda sitting tight. That’s typically a sign of strength. The chart he shared even hints at a potential pop to $4.50 by April, assuming things play out the same way they did during that late 2017 bull run.
He also pointed to broader market trends like big stock moves and macro stuff lining up in XRP’s favor. If everything falls into place, he expects a big wave 5 rally — the kind of euphoric, everybody’s-talking-about-it pump.
RSI Divergence? Another Bullish Clue
Another analyst, CasiTrades, chimed in on X (formerly Twitter) with a bullish take of her own. She spotted a bullish divergence on the RSI — a signal that momentum might be shifting even if the price hasn’t quite caught up yet.
According to her, sellers are pretty much outta steam. XRP’s price is holding up at a key level: the $2.36 zone, which lines up with the 0.618 golden retracement (if you’re into Fibonacci stuff). She thinks this might be the bottom of wave 4 in the Elliott Wave structure.
If she’s right, the next move could be wave 5 — and that means higher highs. Like, way higher.

Key Levels to Watch
Here’s what CasiTrades says are the levels to keep an eye on:
- Support: $2.36 – this is where price has been holding steady.
- Next resistance: $2.70 – flipping this could trigger the next leg up.
- Upside targets: $3.05 and $3.40, which are continuation targets.
- ATH test zone: $3.80 — a big milestone if the rally gets real momentum.
She’s sticking to her view that the bigger bullish structure for XRP is still intact — and that a breakout might just be around the corner.