- Stellar is up 2.8% this week but remains down nearly 30% over three months.
- RSI shows a hidden bearish divergence despite growing social buzz and rising RWA value.
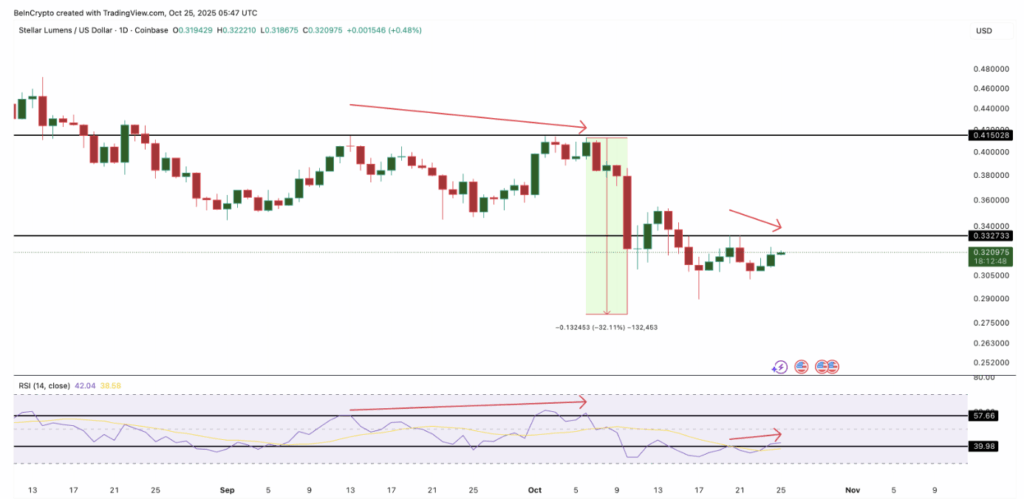
- Key resistance lies at $0.38 and $0.41; failure to hold $0.30 could drag XLM toward $0.23.
Stellar’s price is showing a bit of life again—up around 2.8% over the past week—but the bigger picture still leans bearish. Over the last three months, XLM has fallen nearly 29%, struggling to find lasting momentum even after a few short-lived bounces. Traders are now zeroed in on one crucial level that could decide whether this rebound turns into an actual recovery or just fizzles out into another leg lower.
Bearish Divergence Creeps In as Social Buzz Spikes
Here’s the thing: even with strong on-chain growth and a flood of chatter across social media, the chart isn’t looking all that healthy. The Relative Strength Index (RSI), which tracks buying versus selling pressure, is showing a hidden bearish divergence—basically, a sign that momentum is fading even though the price appears to be pushing higher.
Between October 20 and 25, Stellar made a lower high while the RSI made a higher one. That mismatch often hints that buyers are losing strength. A nearly identical setup appeared from mid-September to early October, and that was followed by a steep 32% correction. So yeah, traders are on alert again, watching for another potential dip if the same pattern repeats.
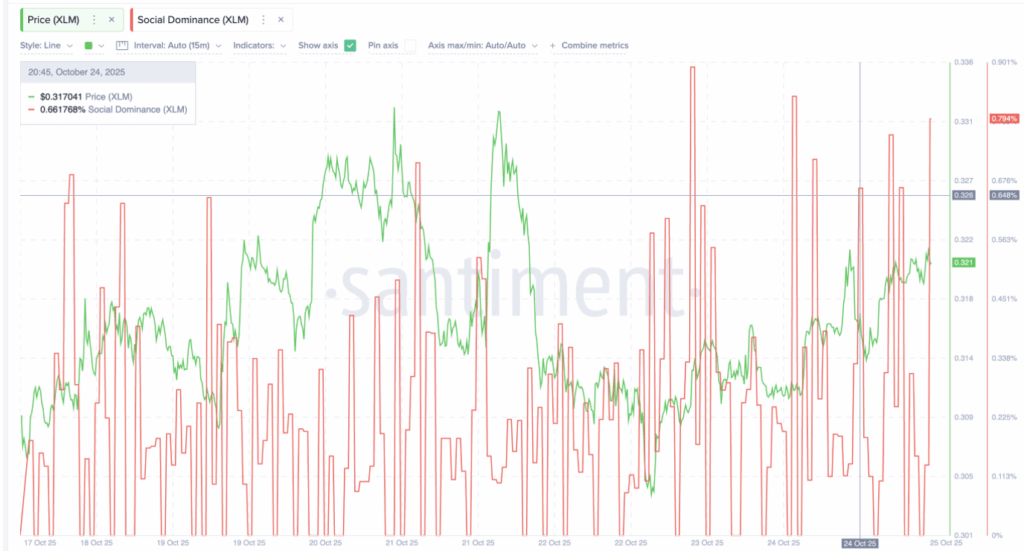
Meanwhile, outside the charts, things look surprisingly upbeat. Stellar’s tokenized real-world asset (RWA) value has climbed over 26% in the last 30 days, now sitting around $638.8 million. The project’s social dominance is also on the rise, jumping from 0.648% to 0.794% in just one day. But more talk doesn’t always mean more buying—and that’s exactly what the data shows. There’s a clear disconnect between hype and actual price action right now.
XLM Stuck Below Resistance at $0.38
Looking at the daily chart, Stellar remains trapped inside a descending channel. Every time the price tries to move higher, selling pressure quickly kicks back in. The structure is still bearish, showing that the market hasn’t flipped yet. For XLM to start showing real strength, it would need to break cleanly above $0.38—the top of that channel. Doing so would mark a 20% rise from current levels and could finally shift short-term sentiment from bearish to neutral, maybe even bullish if momentum holds.
Still, the key level to watch is $0.41, a resistance zone that’s rejected multiple rally attempts since September. Clearing that could confirm a larger trend reversal. On the other hand, if XLM can’t defend $0.30, it risks sliding back down toward $0.23, which marks the next major demand zone. For now, it’s a waiting game between cautious optimism and the familiar weight of selling pressure that’s haunted Stellar for months.