
- WIF Down 87% from ATH: Once the largest meme coin in the Solana ecosystem, WIF has plummeted from its March 2024 peak, now hovering at a critical support level.
- Bearish Indicators Persist: RSI remains below 50, and MACD is still negative, suggesting continued downside risk—a drop to $0.20 is possible if support fails.
- Breakout or Breakdown? If WIF reclaims $1.40, it could rally toward $3.19, but if it breaks below the channel, a new all-time low may be next.
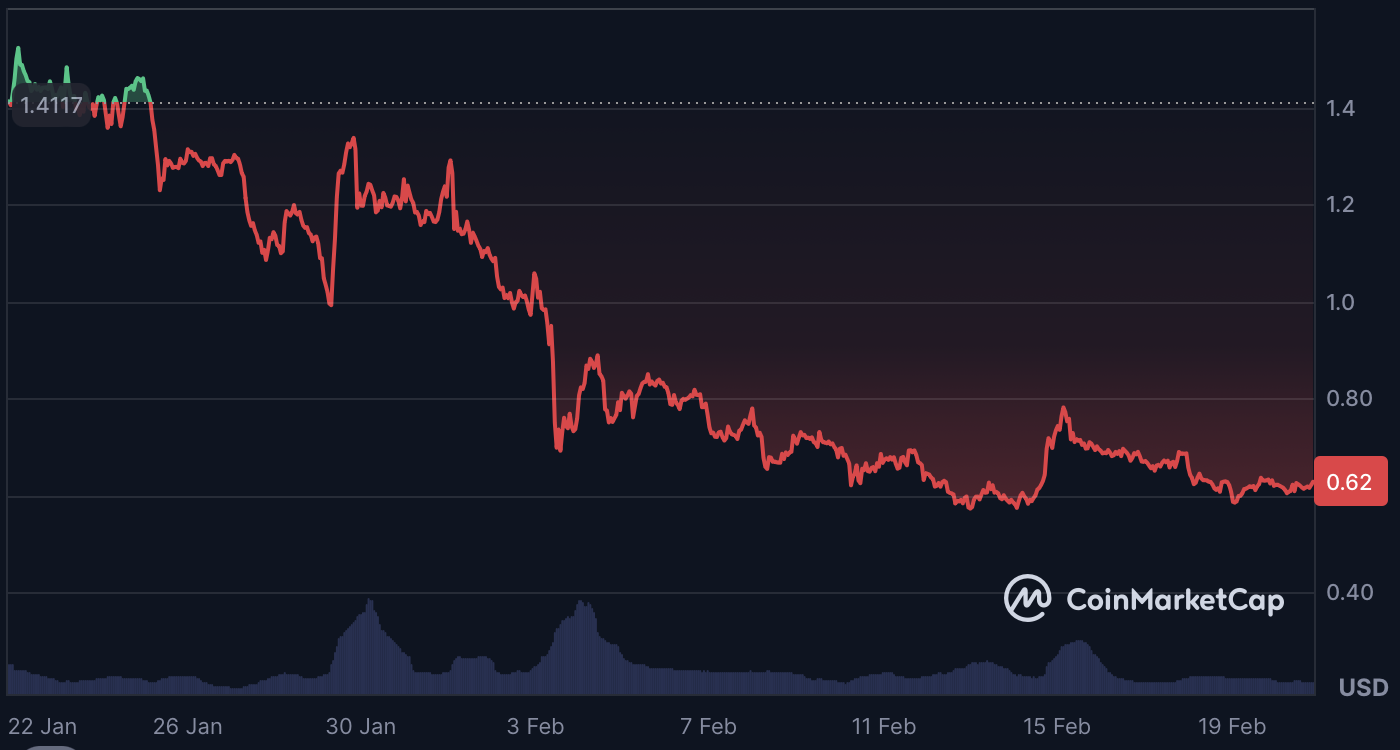
Once a standout performer, WIF skyrocketed nearly 3,000% to its all-time high (ATH) in March 2024, solidifying itself as the largest meme coin in the Solana ecosystem. But the glory was short-lived. WIF has since tumbled out of the top 100, with its price suffering a brutal 87% crash from its peak, hitting a low of $0.55 on Feb. 3, 2025.
Now, with WIF sitting at a major support level, traders are asking: Is this the moment for a comeback, or is more pain ahead?
WIF Hits Critical Support
A look at WIF’s weekly time frame chart tells the story—since April 2024, it has been trapped inside a long-term descending parallel channel. This downtrend includes multiple lower highs, including those in March and November 2024 (red markers).
During this brutal decline, WIF fell below the channel’s midline and lost $1.40 horizontal support, leaving just one final level before a new all-time low.
Since February, WIF has been hovering around the channel’s lower boundary, but here’s the problem—no clear bullish signals have emerged yet. That said, this is exactly the kind of level where a strong bounce could happen.
Indicators Flash Bearish—More Downside Ahead?
Technical indicators are not painting a pretty picture:
- Relative Strength Index (RSI) remains below 50, failing to hint at any recovery.
- Moving Average Convergence/Divergence (MACD) is stuck below zero, signaling ongoing bearish pressure.
If WIF breaks below this critical level, things could get ugly fast—$0.20 might be the next stop.
Has the Correction Ended?
Despite the lack of bullish signals, WIF’s wave count suggests that the correction could be nearing its end. The structure hints at a completed A-B-C pattern, where wave A and wave C are nearly equal in length.
Additionally, a five-wave sub-count within wave C has formed, further aligning with the idea that a bottom could be near.
To confirm this scenario, WIF must reclaim $1.40. A successful push past this level could see WIF targeting the 0.5-0.618 Fibonacci retracement zone, between $2.69-$3.19.
Final Verdict—Breakout or Breakdown?
Two scenarios are in play:
- If WIF reclaims $1.40, expect a push toward the upper channel boundary, possibly reaching $3.19.
- If WIF collapses below the channel, the decline could be part of a larger wave three drop, meaning a new all-time low is on the table.
For now, WIF clings to its final diagonal support. While a trend reversal hasn’t been confirmed, wave structure hints that this correction could be nearing its last stretch. Whether the meme coin stages a miraculous comeback or faces another leg down—it’s make-or-break time.