- Sui’s Bollinger Bands are the tightest in history, echoing setups before its past 250% and 400% rallies.
- Technical signals, including a bounce from the 0.618 Fibonacci level, point toward pressure building for a breakout.
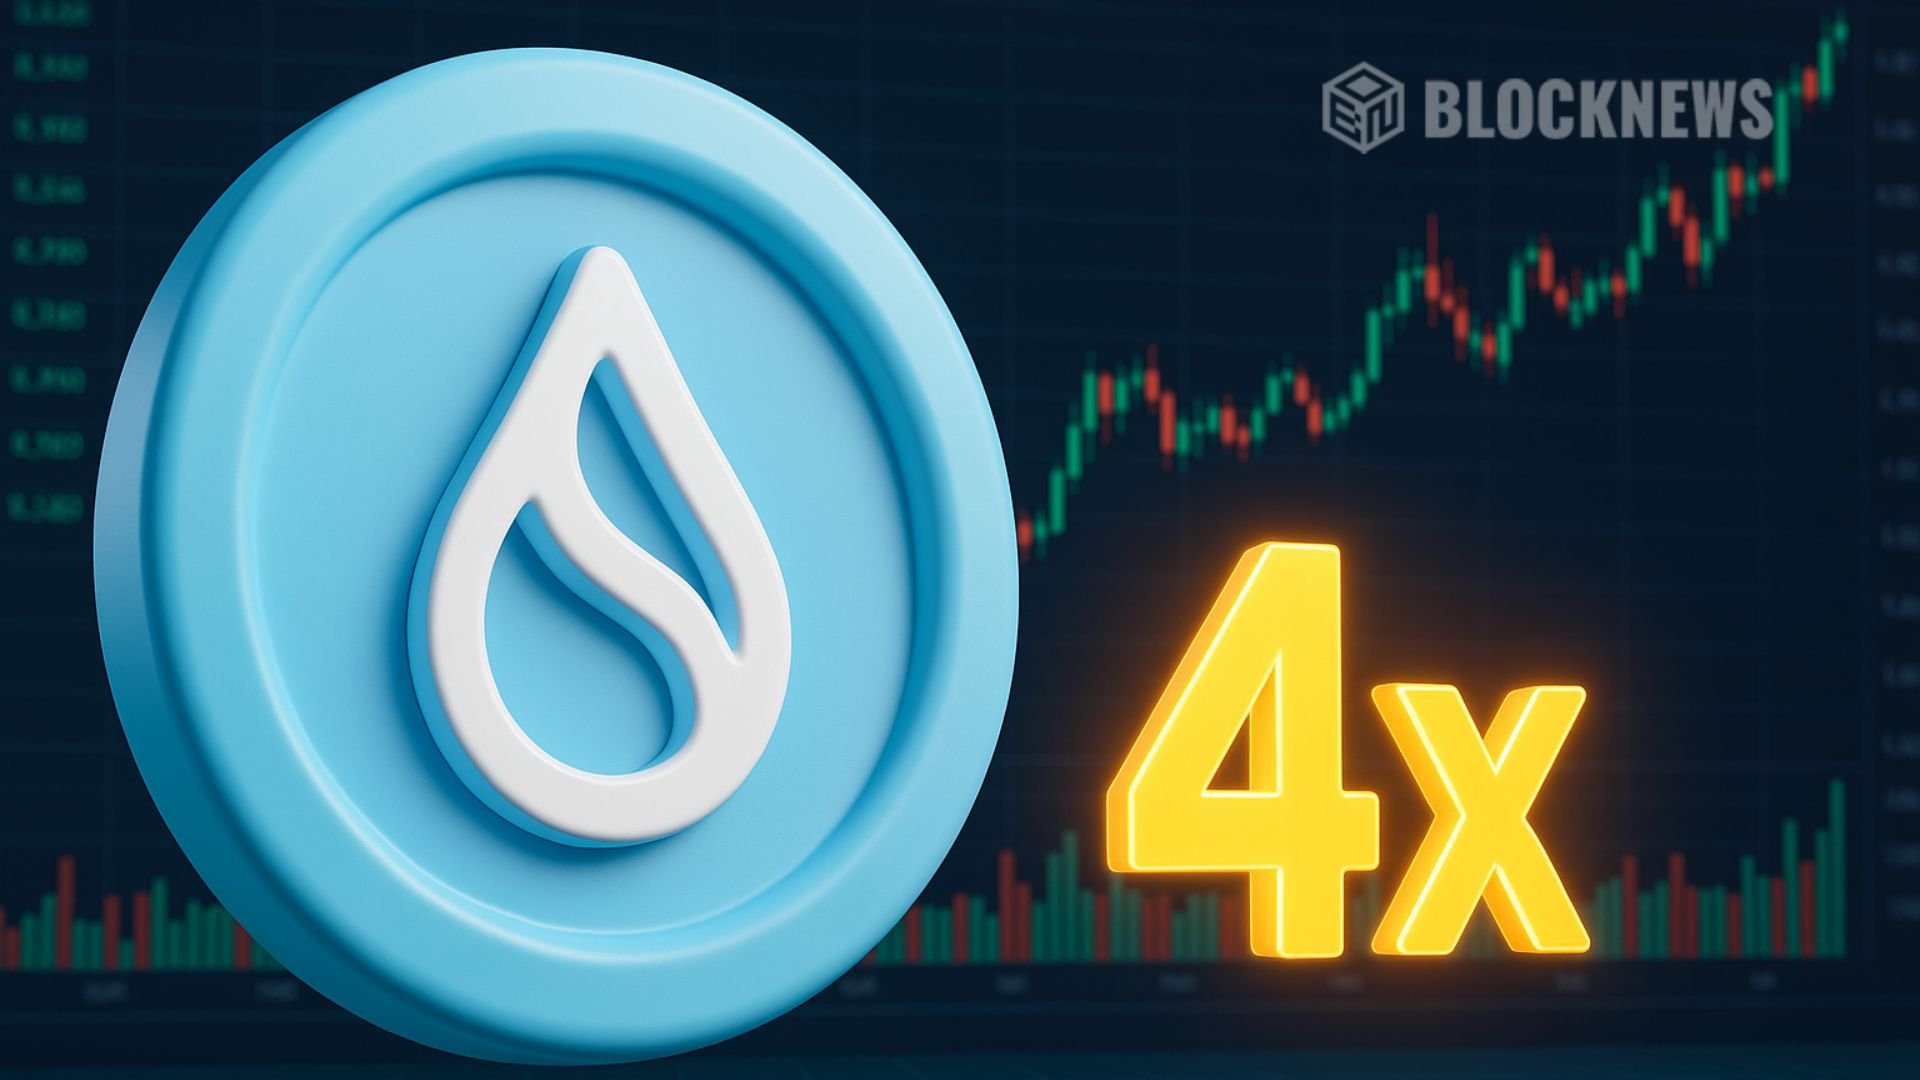
- If history repeats, SUI could rally 150%–200%, targeting the $6–$8 range in the coming months.
Sometimes markets move in ways that feel oddly familiar, almost like you’ve seen the scene before. That’s exactly what’s happening with Sui (SUI) right now. The price chart is flashing a setup that traders have watched play out before—and the similarities are tough to ignore.
CryptoBullet, a well-followed analyst, spotted something interesting. The Bollinger Bands on Sui’s chart—basically those lines traders use to measure volatility—are the tightest they’ve ever been. When price action gets squeezed that hard, it’s like a spring being coiled tighter and tighter. And usually, when it snaps, it doesn’t do so quietly.
Bollinger Bands Hint at Pressure Building
CryptoBullet compared the current setup to two earlier Sui moments. Back in late 2023, SUI moved sideways for weeks before it ripped more than 250% higher by early 2024. The same thing happened again in September 2024, when the token rallied over 400% in just a few months. Now, in September 2025, the Bollinger Band Width has hit that same 63 reading—just like before the earlier rallies.
Even more, the mid-line of the Bands has already been reclaimed. That’s a small but important detail because it signals buyers are holding their ground. On top of that, SUI has bounced right off the golden 0.618 Fibonacci retracement level, a spot where past runs often kicked off. It’s like the chart is dancing to the same rhythm all over again.
Could SUI Rally 150%–200% Again?
If the pattern holds, CryptoBullet suggests we could be looking at a 150% to 200% jump. That would put SUI somewhere in the $6 to $8 range, levels not seen in a long time. Nothing’s ever guaranteed in crypto—patterns don’t always repeat—but when they rhyme this closely, it tends to get traders excited.
Some even compare it to Solana’s early days, when repeating technical structures paved the way for monster rallies. Of course, Sui is its own beast with different fundamentals, but the resemblance on the charts is striking enough to keep traders glued to it.
Anticipation Runs High
Sui has a history of blasting upward once volatility compresses to extremes. And right now, the compression is tighter than ever. That doesn’t mean a breakout is certain—but it does mean something big might be brewing. CryptoBullet’s analysis doesn’t call the exact timing, yet it highlights a setup that’s worked twice before.
And in crypto, sometimes that’s all the spark you need for the crowd to start watching closely again.