- Bitcoin’s drop is separating conviction buyers from reactive treasury plays
- Justin Sun’s timing contrasts sharply with late-cycle corporate accumulation
- This move is about signaling control during stress, not calling a BTC bottom
Bitcoin sliding more than 20% from mid-January highs has exposed a clear split in behavior. As price slipped toward the mid-$74K range, many digital asset treasury firms that bought near the top found themselves sitting on drawdowns exceeding 30%. Those buyers were framed as long-term stewards, but market stress has a way of testing how real that conviction actually is. When volatility returns, narratives get thinner fast.
Sun’s Buy Is About Timing, Not Bravado
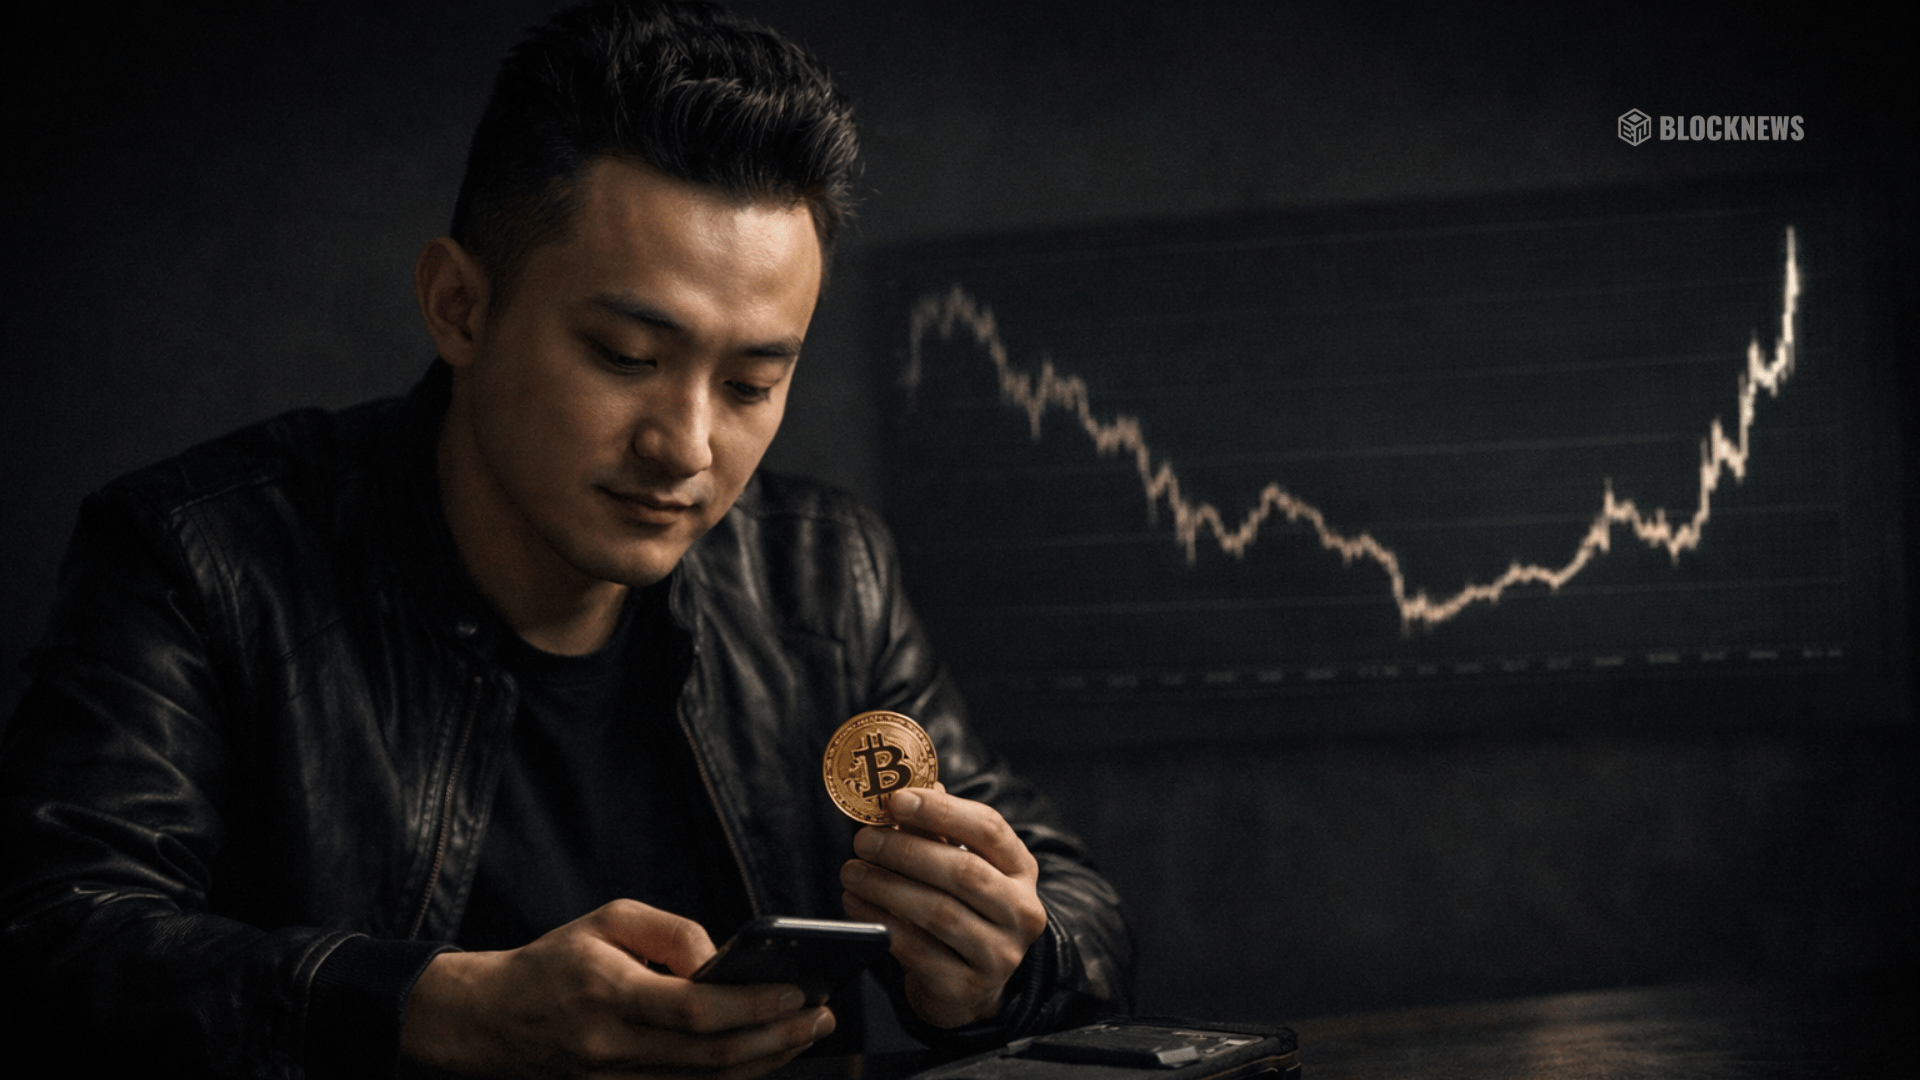
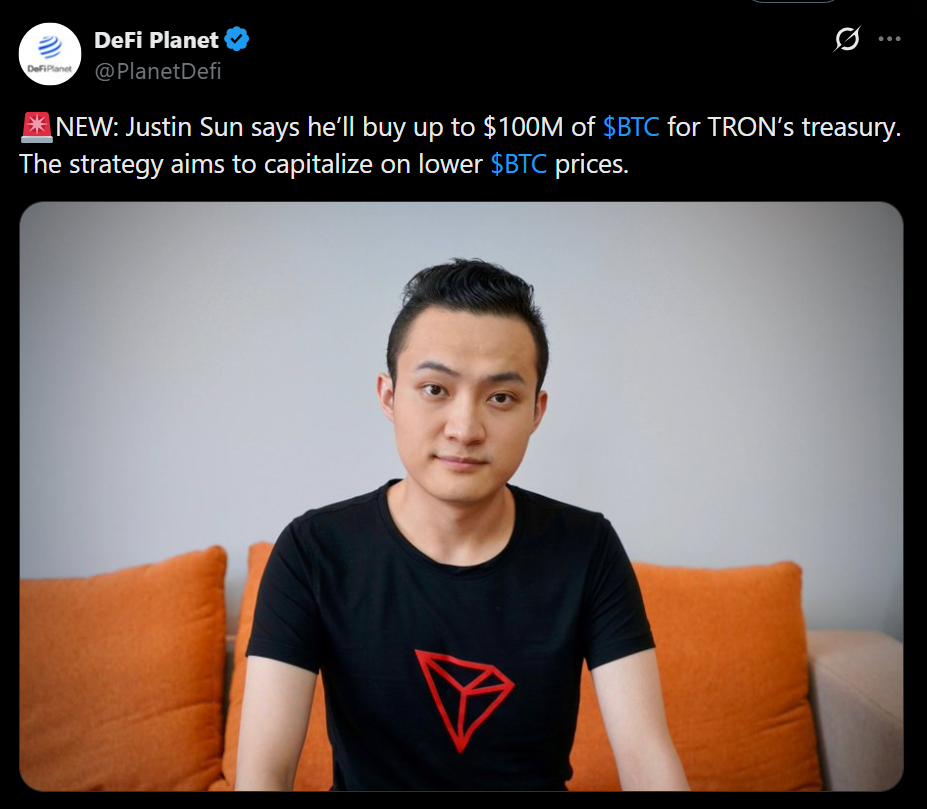
Justin Sun’s plan to buy between $50 million and $100 million worth of Bitcoin reads as bold at first glance, but it’s mostly disciplined. He’s stepping in during weakness, not chasing strength or headlines. That distinction matters. This is what accumulation looks like when liquidity tightens and sentiment sours. Quiet, measured, and opportunistic, rather than loud or celebratory.

The Treasury Strategy Gets Exposed
The last cycle made balance-sheet Bitcoin look like a one-way bet. This drawdown shows the flaw in that thinking. Buying near highs and branding it as strategy does not insulate anyone when volatility snaps back. Sun’s timing implicitly critiques that approach. He waited. Others rushed in when confidence was cheap and charts were green.
TRX Adds Context to the Move
TRX holding above its December lows and maintaining a broader uptrend adds an important subplot. Sun isn’t acting from desperation. He’s operating from relative strength while others defend underwater positions. That difference shapes how markets interpret intent and credibility during stress periods.
Conclusion
This isn’t a heroic Bitcoin moment or a guaranteed bottom signal. It’s a live stress test of conviction. Justin Sun’s move doesn’t promise upside, but it clearly highlights who understands cycles and who merely borrowed confidence from a rising chart.