- Trump memecoin trades in a tight range between $8.1 and $8.5 after its September peak of $9.25.
- Futures inflows and a 78% long dominance suggest bullish sentiment, but Spot data shows aggressive selling.
- Whales continue accumulating, signaling confidence, but TRUMP must clear $9.16 to confirm a reversal.
Since touching $9.25 on September 1, Official Trump (TRUMP) has been stuck in a narrow range. For more than a week, the memecoin has moved between $8.1 and $8.5, consolidating while traders prepare for its next big move. Both retail investors and whales have been using this cooldown to reposition themselves, but the signals from Spot and Futures markets are telling slightly different stories.
Trump Futures Demand Surges as Traders Go Long
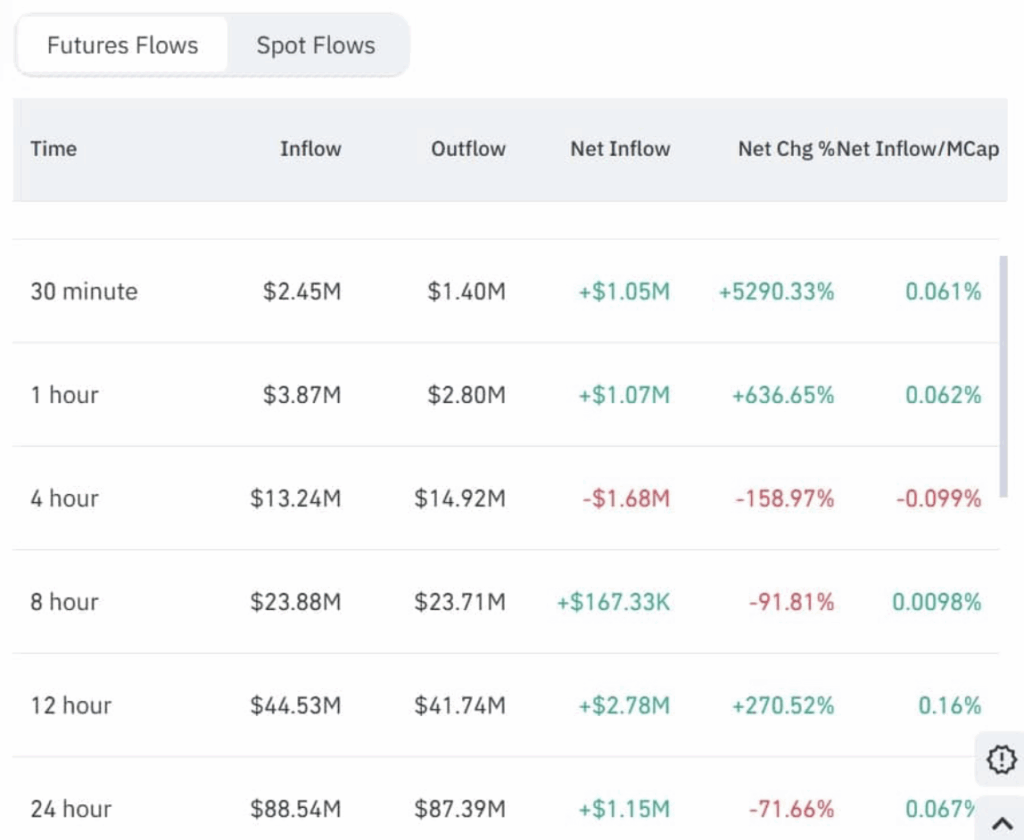
Whales piling into TRUMP aren’t just buying tokens—they’re also loading up in the Futures market. Data from CoinGlass shows $88.54 million flowing into Trump Futures against $87.39 million in outflows, leaving a net inflow of $1.15 million. On top of that, the Long/Short Ratio spiked to 3.61, with longs making up 78% of positions. That kind of dominance usually reflects bullish sentiment, as traders bet on higher prices in the near term.
Spot Traders Keep Selling Despite Futures Inflows
The story looks different on the Spot side. Coinalyze data revealed TRUMP recorded a negative Buy/Sell Delta for seven of the last eight days. In total, Sell Volume hit 23.497 million compared to 22.17 million in Buy Volume, leaving a -1.32 million gap. Exchange flows echoed this pressure, with CoinGlass showing two consecutive days of positive Spot Netflow—$187,000 first, then a bigger $3.73 million inflow. Historically, higher Spot inflows often precede waves of selling pressure, which explains why the token has struggled to push higher.
Whales Quietly Add More TRUMP Tokens
While retail has been unloading, whales are still quietly stacking. Nansen data showed TRUMP’s Whale Balance Change has been positive for five straight days. At press time, top holders added 121k tokens—up sharply from 44k just a day earlier. A positive balance shift like this typically signals steady accumulation, and it’s often a bullish undertone, even when the broader market is shaky.
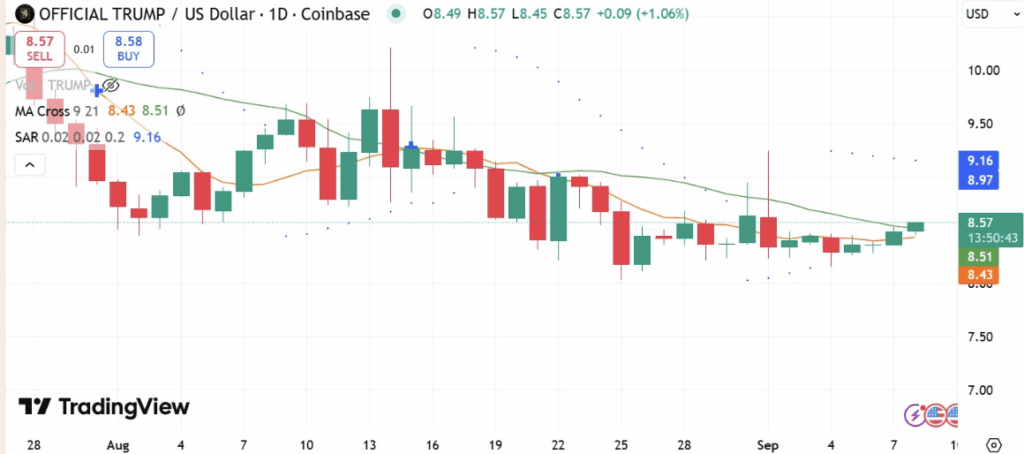
TRUMP Price Chart Stuck Between Key Levels
Technically, TRUMP’s chart reflects this tug-of-war. The memecoin sits above both its 21-day and 9-day moving averages, hinting at short-term upward momentum. However, it remains under the Parabolic SAR level of $9.16, which tilts the bias slightly bearish. For bulls to regain control, TRUMP needs a decisive close above $9.16. If it fails, the next downside levels sit at $8.43 and $8.20 support.