
- TRX broke below a two-year parabolic support line and lost the $0.315 horizontal level, signaling a major structural breakdown with a potential drop toward $0.220.
- Weekly indicators—including bearish divergences in RSI and MACD—reinforce a long-term bearish outlook despite the recent bounce.
- The daily chart shows a double-bottom formation and bullish divergences, but upside appears limited to the $0.30 resistance, where the next major test awaits.
Tron managed to spark some excitement after a sharp bounce lifted TRX off its latest lows, pulling it back into the spotlight for the first time in weeks. But even with the sudden recovery, the deeper structure behind the chart isn’t exactly screaming strength. In fact, it shows damage that could still cap any real upside unless bulls step up with something stronger.
After breaking below a parabolic trend that carried TRX for more than two years, market watchers want to know one thing: is this bounce legit… or just a breather before another drop?
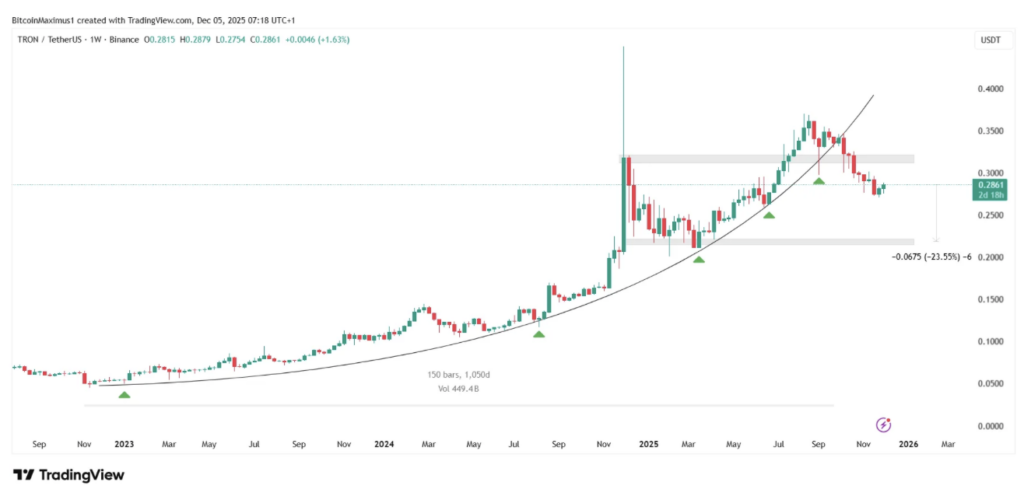
TRX Breaks Its Two-Year Parabolic Support
On the weekly chart, TRX had been riding a beautiful parabolic trend since early 2023. It bounced off the same rising support line multiple times, almost like clockwork. But in October, that changed.
TRX sliced through the trendline (black circle), officially ending the long-running parabola. And to make matters worse, the price also closed below the $0.315 horizontal support, confirming that sellers had taken control of the entire structure.
Once a trend loses both diagonal and horizontal support, it’s usually a sign the decline is real—not a temporary shakeout.
With that break, the next major support sits much lower, near $0.220, meaning TRX could still fall another ~23% before hitting a true demand zone.
Momentum Indicators Flash Red
If price structure wasn’t worrying enough, momentum indicators are flashing even louder warnings:
- RSI shows a bearish divergence
- MACD shows a bearish divergence
- RSI is below 50
- MACD is fully negative
All of these together reinforce the bearish setup. TRX breaking its long-term structure + multiple divergences = usually not a signal bulls want to see.
Given that combination, the charts suggest a likely move down toward the $0.225–$0.220 region before the market finds its footing again.
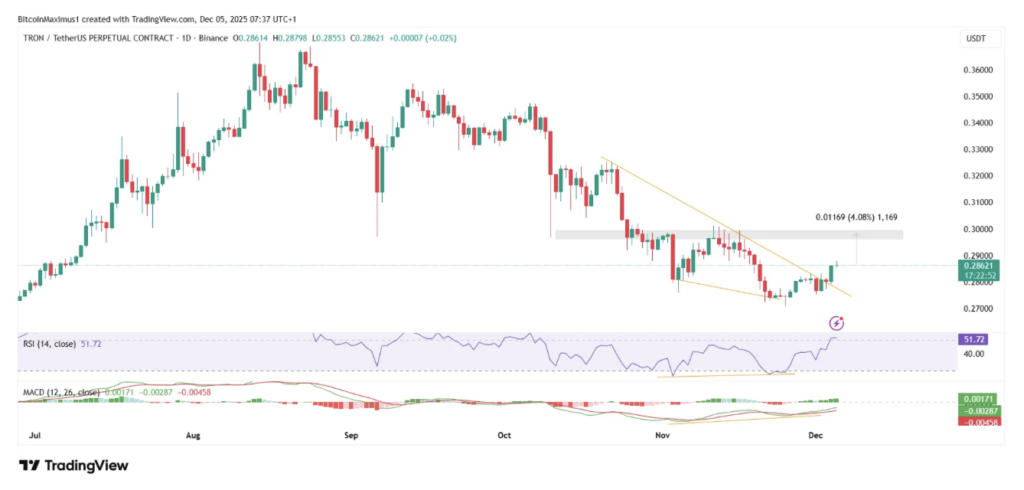
Short-Term Chart Shows a Glimmer of Hope
Not everything is doom-and-gloom though. The daily chart is telling a slightly different story.
TRX has formed a double-bottom pattern, which is often an early reversal signal. And this bullish formation is supported by:
- RSI bullish divergence
- MACD bullish divergence
These short-term signals suggest a decent bounce is still possible. But here’s the catch: upside seems limited.
The biggest ceiling in the short term sits at $0.30, and even a strong bounce likely won’t push beyond that. At most, the structure supports around a 4% move upward. After that, unless resistance breaks, the broader downtrend probably resumes.
Bounce Before Breakdown
Tron’s recent move is encouraging if you’re watching lower timeframes, but zoom out and the bigger trend still leans bearish. The break of a two-year parabolic support line is a major structural change—one that typically leads to deeper corrections, not quick recoveries.
Short-term momentum may keep things alive for now, but TRX needs to reclaim multiple resistance layers before the long-term trend can flip bullish again. Until that happens, buyers should stay cautious. The real test sits at $0.30, and if that wall doesn’t break, the next leg down may follow.