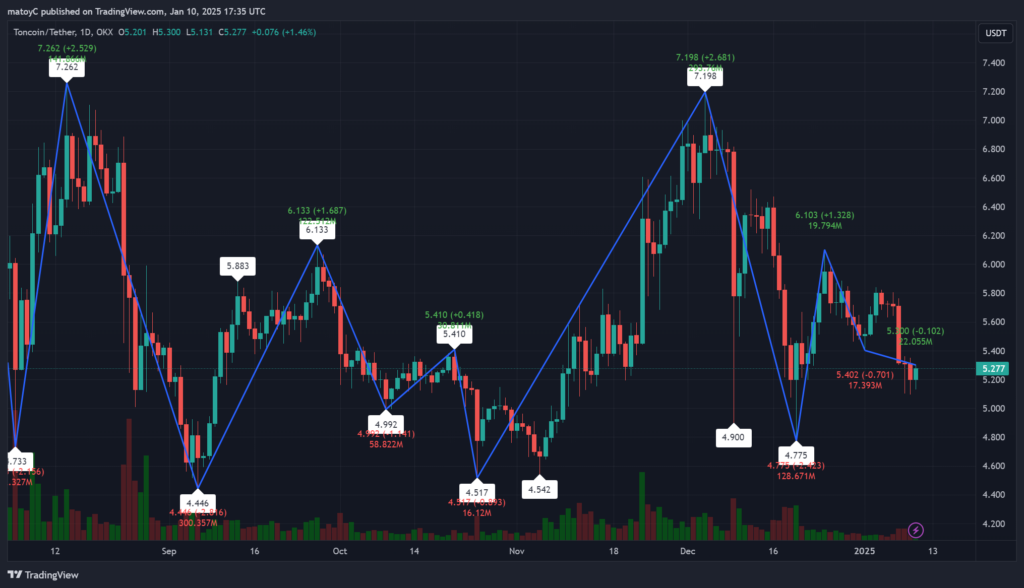
- Toncoin’s large swings highlight a period of price consolidation with resistance near $7.20.
- Key support levels around $5.40 and $4.75 signal crucial zones for future movements.
- Volume trends indicate rising participation during price declines, hinting at market sentiment.
Toncoin has been moving within a tight range recently, with its price activity marked by notable swings between key support and resistance levels. The cryptocurrency touched a high of $7.26 before encountering strong selling pressure, leading to a decline and a subsequent bounce off the $4.45 mark. These fluctuations underscore the significance of its current consolidation phase, as buyers and sellers attempt to tip the scale in their favor.
According to the TradingView chart, the range between $5.40 and $7.20 has emerged as a critical zone for market sentiment. On one hand, sellers have repeatedly pushed back attempts to break past resistance at $7.20. On the other, buyers continue to hold the line near $5.40, signaling resilience in these lower price levels. Meanwhile, the trading volume has increased during dips, hinting that some traders may be preparing for a potential breakout or further price movement, though the direction remains unclear for now.
Sellers Dominate Resistance as Buyers Anchor Key Levels
Attempts to push Toncoin past the $7.20 resistance have consistently been met with selling pressure, demonstrating the strength of sellers at higher levels. While rallies toward this point generate some optimism, the cryptocurrency has struggled to sustain upward momentum, resulting in pullbacks.
The $5.40 level has consistently served as a strong support zone, offering a safety net for buyers. Should Toncoin dip below this point, the $4.75 support level will likely come into play as the next critical area to watch. These zones remain essential markers for traders gauging future movements.
Additionally, volume trends reveal a surge in activity during price declines, indicating growing market participation. While this could be seen as an accumulation phase, it also suggests cautious sentiment, as traders appear more inclined to act during pullbacks rather than chasing upward trends.

Sentiment and Indicators Suggest Cautious Optimism
Technical indicators provide a mixed picture. The 50-day moving average points to slight downward pressure, while the Relative Strength Index (RSI) hovers around neutral levels, reflecting indecisiveness in the market. A push above $7.20 could trigger a rally toward $8, potentially energizing the market. On the flip side, a break below $5.40 may lead to a retest of $4.75 or even lower levels, introducing more volatility into the mix.
Toncoin’s next steps depend heavily on overall market conditions and how participants react to these key levels. Whether it’s poised for an upward rally or further consolidation, traders will likely keep a close watch on this pivotal range for signals of the cryptocurrency’s future direction.


