BlockNews
FOLLOW ON X
  • BITCOIN
  • CRYPTO
    • ETHEREUM
    • RIPPLE XRP
    • SOLANA
    • CARDANO
    • BINANCE BNB
    • DOGECOIN
    • TRON
    • SUI
    • CHAINLINK
    • LITECOIN
  • FINANCE
  • POLITICS
  • MEMECOINS
  • NFT
  • OPINION
No Result
View All Result
BlockNews
  • BITCOIN
  • CRYPTO
    • ETHEREUM
    • RIPPLE XRP
    • SOLANA
    • CARDANO
    • BINANCE BNB
    • DOGECOIN
    • TRON
    • SUI
    • CHAINLINK
    • LITECOIN
  • FINANCE
  • POLITICS
  • MEMECOINS
  • NFT
  • OPINION
No Result
View All Result
BlockNews
Home CRYPTO

These XRP Technical Indicators Suggest Incoming Bullish Breakout: Here are the Levels You Need to Watch

Michael Juanico by Michael Juanico
April 14, 2025
in CRYPTO, FINANCE, OPINION
Share on XShare in TelegramShare on Reddit
  • XRP bounced off the $1.70 support level, showing signs of slowing bearish momentum and potential reversal.
  • The token remains stuck between the 100-day and 200-day moving averages, hinting at continued consolidation.
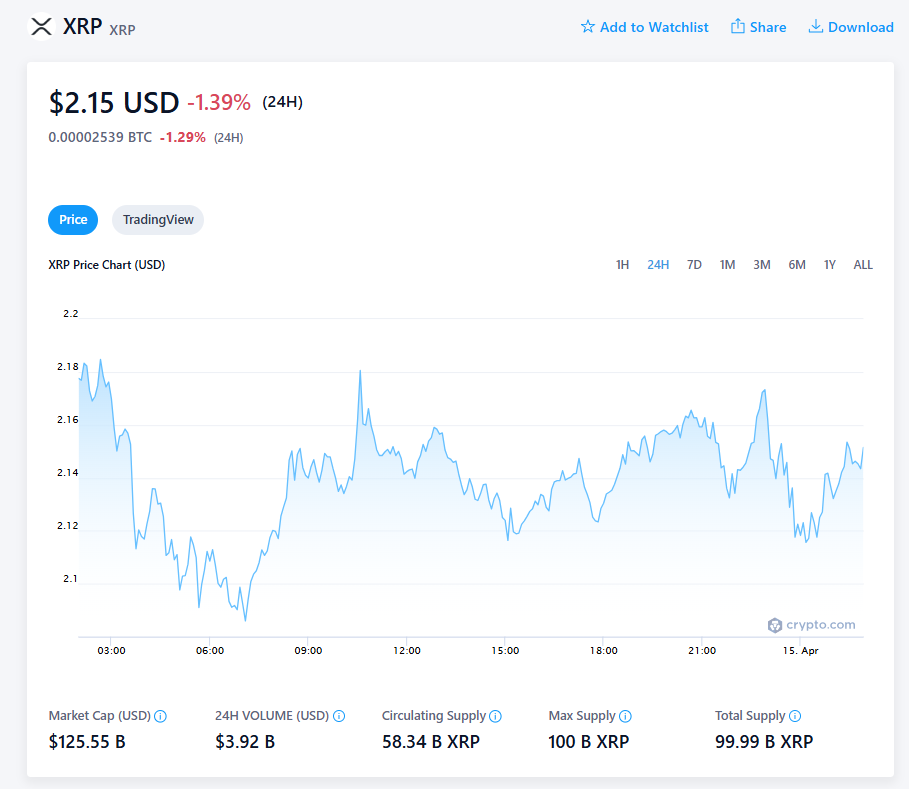
  • A breakout above $2.20 could spark a bullish trend, but failure to clear it might send XRP back toward $1.70.

XRP‘s been catching some breath lately, bouncing right off that $1.70 zone — yeah, the one where the 200-day moving average and Fibonacci retracement lines kinda overlap. That combo acted like a soft cushion, giving bears a reason to chill out… at least for now.

Traders jumped in as the price held steady, and we even saw a bullish divergence on the RSI. That’s usually a good sign — it hints the selling pressure’s easing up, maybe even gearing up for a trend flip. But before we get carried away, XRP’s still sandwiched between the 100-day and 200-day moving averages. So, it’s kinda stuck in a holding pattern.

Worth noting — that 100-day MA at around $2.50? Yeah, it lines up perfectly with the top of this long descending wedge XRP’s been trapped in. If — and it’s a big if — XRP can break out above that level, it could light the spark for a solid upward move toward fresh resistance levels.

Xrp Price Chart

Zooming In: 4-Hour Chart Gets Interesting

Looking closer, the short-term picture’s showing some action. XRP faked a bearish breakout from an expanding wedge but then pulled a U-turn — classic bear trap vibes. Price popped back into the pattern, which caught some eyes and triggered a decent wave of buying.

Now it’s heading toward that $2.20 mark — the previous local high and a big decision point. If XRP can close strong above $2.20, we’d be talking higher highs and, potentially, a real shift in structure that could drag the price closer to $2.50 again.

That said, if momentum fizzles out and $2.20 holds as resistance, a pullback to $1.70 wouldn’t be surprising. It’s still a coin toss right now — but at least we’re seeing signs of life.

Disclaimer: BlockNews provides independent reporting on crypto, blockchain, and digital finance. All content is for informational purposes only and does not constitute financial advice. Readers should do their own research before making investment decisions. Some articles may use AI tools to assist in drafting, but every piece is reviewed and edited by our editorial team of experienced crypto writers and analysts before publication.
Tags: Fibonaccipullbackresistancetradersxrp
Tweet2ShareShare
Michael Juanico

Michael Juanico

Michael is a BSBA Management graduate from Mindanao State University and has been a professional content writer since 2019. He began exploring cryptocurrency in 2021 and has since made blockchain and digital assets his primary focus. For nearly four years, Michael has contributed research and editorial content at Aiur Labs and BlockNews, producing clear and accessible coverage of market trends, trading strategies, and project developments. He is transparent about his personal holdings in Bitcoin, TRON, and select meme tokens, combining writing expertise with hands-on market experience to deliver trustworthy insights to readers.

DON'T MISS THESE! HOT OFF THE PRESS

HBAR Correlation With Bitcoin Hits 0.87 While Support at $0.130 Gets Tested — Here is Why That Matters
BITCOIN

HBAR Correlation With Bitcoin Hits 0.87 While Support at $0.130 Gets Tested — Here is Why That Matters

December 2, 2025
Virtual Protocol Slides Deeper as Selling Pressure Builds and Demand Weakens
CRYPTO

Virtual Protocol Slides Deeper as Selling Pressure Builds and Demand Weakens

December 2, 2025
Pudgy Penguins (PENGU) Rejected at Key Resistance and Bleeds Capital — Here is What the Charts Are Signaling
CRYPTO

Pudgy Penguins (PENGU) Rejected at Key Resistance and Bleeds Capital — Here is What the Charts Are Signaling

December 2, 2025
Can AAVE Recover After Heavy Whale Dumping and Negative Buy-Sell Delta? — Here is What the Charts Say
CRYPTO

Can AAVE Recover After Heavy Whale Dumping and Negative Buy-Sell Delta? — Here is What the Charts Say

December 2, 2025
Litecoin Extends Its Slide as Volume Surges, Testing a Make-or-Break Support Zone
CRYPTO

Litecoin Extends Its Slide as Volume Surges, Testing a Make-or-Break Support Zone

December 2, 2025
Chainlink Slips After Sharp Rejection, Showing Fresh Signs of Exhaustion
CHAINLINK

Chainlink Slips After Sharp Rejection, Showing Fresh Signs of Exhaustion

December 1, 2025
Load More

Related News

HBAR Correlation With Bitcoin Hits 0.87 While Support at $0.130 Gets Tested — Here is Why That Matters

HBAR Correlation With Bitcoin Hits 0.87 While Support at $0.130 Gets Tested — Here is Why That Matters

December 2, 2025
Virtual Protocol Slides Deeper as Selling Pressure Builds and Demand Weakens

Virtual Protocol Slides Deeper as Selling Pressure Builds and Demand Weakens

December 2, 2025
Pudgy Penguins (PENGU) Rejected at Key Resistance and Bleeds Capital — Here is What the Charts Are Signaling

Pudgy Penguins (PENGU) Rejected at Key Resistance and Bleeds Capital — Here is What the Charts Are Signaling

December 2, 2025
Can AAVE Recover After Heavy Whale Dumping and Negative Buy-Sell Delta? — Here is What the Charts Say

Can AAVE Recover After Heavy Whale Dumping and Negative Buy-Sell Delta? — Here is What the Charts Say

December 2, 2025
Litecoin Extends Its Slide as Volume Surges, Testing a Make-or-Break Support Zone

Litecoin Extends Its Slide as Volume Surges, Testing a Make-or-Break Support Zone

December 2, 2025
Twitter Telegram Threads

BLOCKNEWS.COM

BlockNews is your premier source for real-time cryptocurrency, blockchain, political and financial market news.

Stay ahead of the herd with BlockNews

RESOURCES

  • About Us
  • Contact Us
  • Editorial Policies
  • Terms and Conditions
  • Privacy Policy
  • Sitemap

DISCLOSURES AND POLICIES

BlockNews provides independent reporting on crypto, blockchain, and digital finance. Content is for informational purposes only and does not constitute financial advice. Sponsored material is always disclosed. By using this site, you agree to our Terms and Conditions and Privacy Policy.

© 2025 BlockNews

No Result
View All Result
  • HOME
  • BITCOIN
  • CRYPTO
    • ETHEREUM
    • RIPPLE XRP
    • SOLANA
    • CARDANO
    • BINANCE BNB
    • DOGECOIN
    • TRON
    • LITECOIN
    • CHAINLINK
    • SUI
  • MEMECOINS
  • POLITICS
  • FINANCE
  • NFT
  • DEFI
  • GUIDES

© 2025 BlockNews