- Stellar (XLM) Under Bearish Pressure: After starting the year at $0.50, XLM has dropped to $0.25, down 8.86% in the past week, with bearish patterns forming on multiple timeframes.
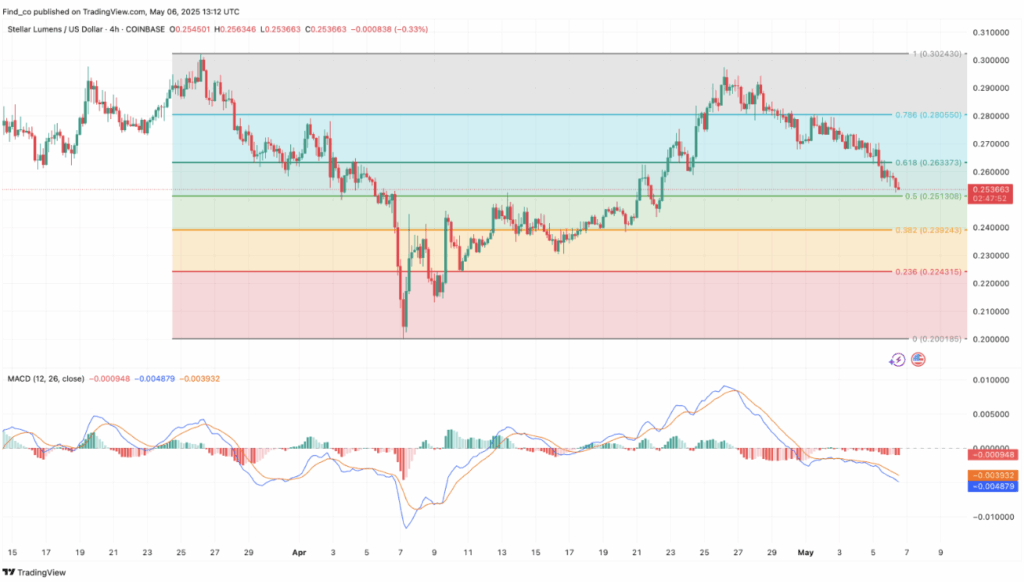
- Technical Analysis – Key Support Levels: XLM is trading within a descending channel, with support at $0.22 and resistance at $0.28. A break below $0.22 could trigger a decline to $0.20, while a move above $0.28 could open the door for a rally toward $0.30.
- Indicators Signal Weak Momentum: The CMF has fallen below zero, indicating rising selling pressure, and the MACD is in negative territory, reinforcing the bearish outlook unless a bullish crossover emerges.
Stellar (XLM) had a solid run in the last quarter of 2024, but 2025 hasn’t been as kind. Starting the year at $0.50, the coin has since slipped to around $0.25, marking an 8.86% drop over the past week. And with XLM’s structure looking shaky across multiple timeframes, the chances of a rebound aren’t exactly looking strong.
XLM Bulls on the Defensive
On the daily chart, XLM is trading within a descending channel — not a great sign for the bulls. This pattern, formed by two downward-sloping trendlines containing lower highs and lower lows, is typically bearish.
Right now, the upper trendline is acting as resistance, while the lower one is holding as support. But there’s more to it. The Chaikin Money Flow (CMF) indicator has dipped below the zero line, signaling that selling pressure is ramping up while demand is falling flat.
And it’s not just the CMF. The Parabolic SAR dots have flipped to sit above the price. Usually, when those dots are below the price, they indicate support and potential for a rally. But above? That’s resistance — a sign that the bears are holding the line.
If this setup continues, XLM might be heading toward a break below the $0.22 support zone.
XLM Price Analysis – Potential Breakdown
Zooming into the 4-hour chart, the bearish signals keep piling up. The Moving Average Convergence Divergence (MACD) indicator is in negative territory, with the 12 EMA below the 26 EMA. This setup typically points to bearish momentum.
If bulls don’t step in soon, the next move could be a slip below the $0.22 support — a level that lines up with the 0.236 Fibonacci level. Should that break down, the next stop could be $0.20.
But it’s not all doom and gloom. If a positive MACD crossover appears and the price manages to break above the $0.28 resistance, we could see XLM claw its way back to $0.30. In a best-case scenario, if the broader market gets bullish, the coin might even attempt to retest its yearly high.
Key Levels to Watch:
- Support: $0.22, $0.20
- Resistance: $0.28, $0.30
- Breakout Confirmation: A close above $0.28 with volume could set the stage for a run to $0.30 and beyond, but losing $0.22 could open the door for further downside toward $0.20.