


- The S&P 500 climbed past its 200-day moving average, hinting the stock correction might be over.
- Bitcoin followed suit, breaking above $88K after crossing its own 200-day average.
- BTC’s next resistance is around $93K, tied to recent short-term holder activity.
Looks like the recent dip in stocks might be done for now—at least, that’s what one key technical signal seems to suggest. And if that’s the case, it could spell good things for Bitcoin too, which is kinda moving in the same direction.
The S&P 500 climbed about 1.7% on Monday, building on last week’s gains. More importantly, it just pushed above its 200-day moving average—a pretty big deal for traders who track this stuff. Basically, it’s a line that averages the last 200 days of closing prices to help spot bigger trends. A lot of people see it as a sign of whether the market’s in a good place or not.
Last time the S&P crossed that same line? March 10. It dipped for a hot second after that, but then kept on climbing—and that run is still going.
Now, over in crypto-land, Bitcoin seems to be tagging along. It’s now sitting above $88K after it broke through its own 200-day average of $85,046 over the weekend. That’s another big signal for investors who watch these levels like hawks.
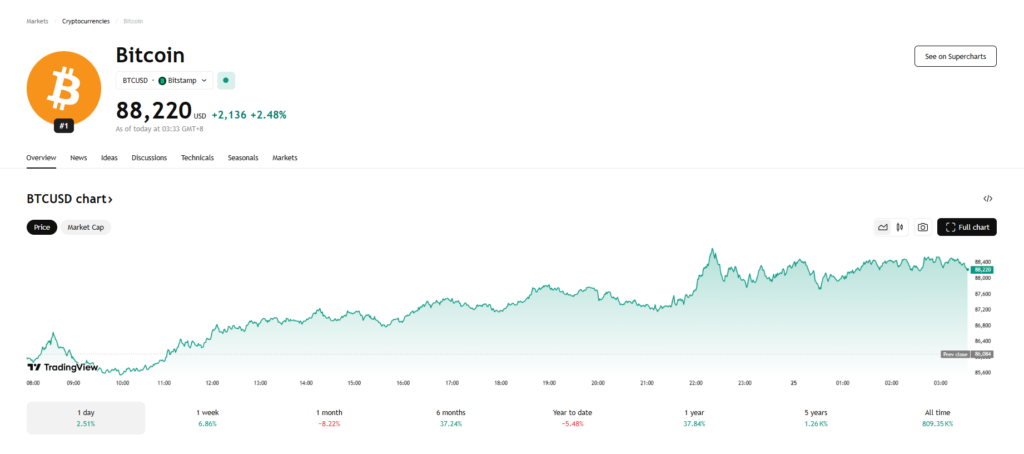
The next big hurdle for BTC? Around $93,245. That number matches up with something called the “short-term holder realized price.” Sounds technical, but in plain terms, it’s the average price paid for coins that people have moved (but not sold) in the last five months or so. Those are the coins most likely to be sold when stuff starts moving.
So yeah—between the S&P holding strong and Bitcoin breaking past key levels, there’s a decent shot this bounce might have some legs. Still, you know how markets are… nothing’s ever totally certain.


