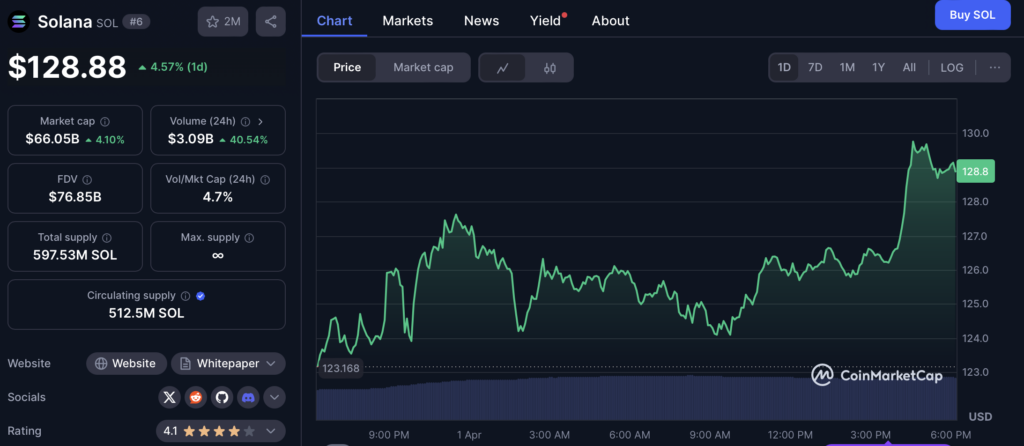
- Solana is consolidating around $125 after a sharp drop, with key resistance at $132 and crucial support between $117–$122.
- Technical indicators are mixed—RSI hints at a bounce, but bearish divergence and weak MACD momentum suggest caution.
- Volume and support reaction will be key; a break above $132 could trigger a rally, while a drop below $117 may lead to a fall toward $102.
Solana (SOL) is sitting right on the edge. After a solid rally up toward $140, the momentum fizzled out and now we’re watching it camp around the $125 mark, trying to figure out which way it wants to break. Traders are watching this one like hawks—because from here, it could go either way.
Recent Slide, Now What?
SOL didn’t just drift into this range. It got smacked down, losing support at $135, then $132, and dipping as low as $122.64 before finding a bit of a footing. Not exactly a gentle landing. But since then? It’s been chopping sideways, trying to figure itself out.
There’s a rising channel forming on the hourly chart, with support near $124, so yeah, short-term structure looks somewhat intact. That said—resistance is stacking. First there’s the 100-hour SMA and $126, right above. Then you’ve got $128, followed by the big one—$132, a level that needs to break for bulls to get their groove back.
A clean close above $132 could send it toward $136, maybe even $142, if things really start heating up. But that’s a big “if.”
Mixed Signals on the Charts (Again)
Let’s talk indicators. Because they’re, well… kinda messy.
On the weekly RSI, there’s a bearish divergence. Price made a higher high, but RSI printed a lower one. That usually means bullish momentum is fading, even if it’s not totally dead yet.
Zoom in a bit and the hourly RSI is back above 50, which could mean short-term strength, but don’t get too comfortable. The MACD is still hanging around the bearish zone—although it’s kinda just drifting sideways now. Basically? No strong signal either way.
RSI sitting around 40 on the higher timeframes has, in the past, been a launch point for rebounds. So that’s something to watch.
Meanwhile, the Parabolic SAR dots just flipped below the price, which is a hint—just a hint—that an upward trend might be trying to sneak in. But again, confirmation’s needed. That level of “wait-and-see” is kinda the vibe right now.
Support Zones You Really Want to Hold
The big one? $117–$122. That range is packed—horizontal support, historical significance, and a key 1.618 Fib level. If SOL starts slipping below that? Things get dicey fast.
Lose $117 and the next likely stop is $115, but honestly, the real danger comes if that fails too. A drop down to $102 isn’t out of the question—and that’s where the bulls start to sweat.
Adding fuel to the fire, there’s a report floating around that a whale dumped $7.6 million worth of SOL recently. That kind of sell pressure doesn’t exactly help build confidence. And it definitely adds weight to the bearish case.
Volume Will Decide Everything
Here’s the deal: volume is key right now. If we see strong buying volume stepping in, there’s a chance for a decent rebound—maybe even a short-term rally.
But if the volume stays weak? That bearish divergence might win out, and the downtrend could deepen heading into Q2.
So What’s the Verdict?
At this point, Solana is at a make-or-break moment. It’s hanging in there just above crucial support, trying to recover from a sharp drop. There’s potential for a bounce—especially if RSI trends up and volume kicks in. But indicators are flashing mixed signals, and recent price action is anything but convincing.
If bulls can push above $132, we might see another leg higher. But if this consolidation rolls over and SOL breaks below $117, it could spiral lower—and fast.
The next few days? Kinda critical.