


- SOL pulls back sharply after an explosive rebound, testing key Fibonacci levels
- MACD hints at weakening momentum, but a bullish crossover could flip the trend
- A make-or-break support zone could decide whether Solana sinks or soars
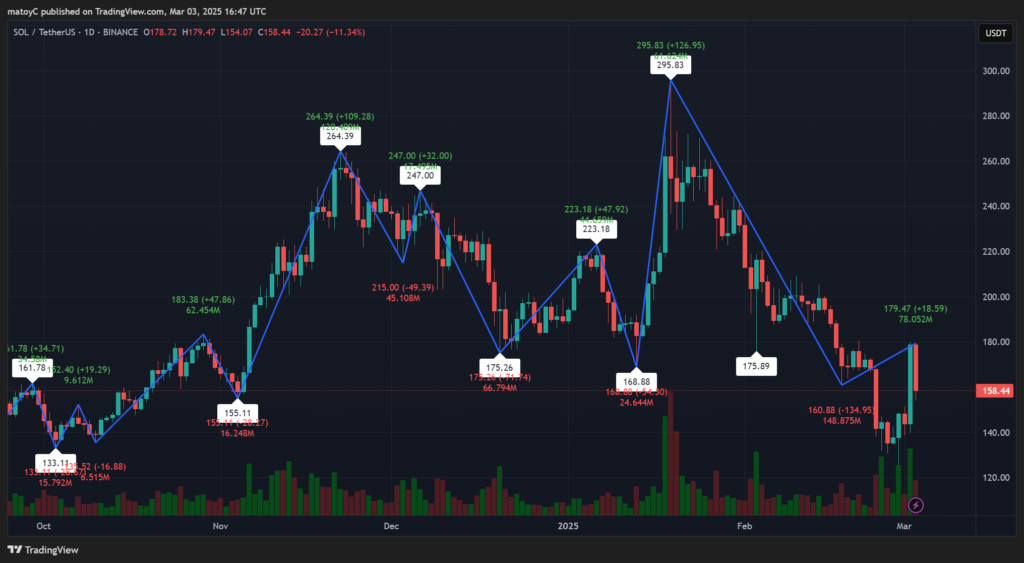
Solana (SOL) has been on a wild ride, with price action swinging dramatically over the past few months. After a strong bounce from $160, SOL briefly surged above $179 before getting slapped back down. This rejection isn’t just random noise—it aligns with a critical Fibonacci retracement level, which often acts as a resistance zone after a big drop.
Looking at the bigger picture in the TradingView chart, this recent pullback comes after an extended downtrend from $295, where SOL saw multiple lower highs. Each rally has been met with strong selling pressure, showing that bears still have control—at least for now.
That said, pullbacks are part of any healthy uptrend, and if SOL can stabilize above key support levels, we might just be looking at a temporary dip before another leg higher.
MACD Shows a Battle Between Bulls and Bears
One of the biggest indicators to watch right now is the MACD (Moving Average Convergence Divergence), which helps traders gauge momentum shifts. Right now, it’s showing some concerning signs—the MACD line is starting to curl downward, which could suggest that bullish momentum is fading.
However, it’s not all doom and gloom. If the MACD manages to form a bullish crossover, that could spark another rally and push SOL back toward $200+. Historically, MACD crossovers on higher timeframes have marked significant trend reversals, so traders should keep a close eye on how this plays out.
For now, the market is in a wait-and-see phase, where a sharp move in either direction is possible depending on how buyers react at key price levels.
The Critical Support Level That Could Change Everything
Right now, $155-$160 is shaping up to be a make-or-break support zone for SOL. This level has acted as a major pivot point in previous cycles, meaning a strong bounce here could trigger another bullish push.
On the flip side, if SOL loses this zone, we could see a deeper correction, possibly down to $140 or even $120. At that point, panic selling could kick in, creating even more downward pressure.
Solana, originally launched in 2020 by Anatoly Yakovenko, has cemented itself as one of the fastest and most scalable blockchains. Its unique proof-of-history consensus mechanism allows it to process transactions at lightning speed, making it a favorite among DeFi and NFT enthusiasts.
As SOL battles between bullish and bearish forces, traders should keep an eye on key indicators like Fibonacci levels, MACD crossovers, and crucial support zones. This current dip might just be another setup for a strong rally—but only if the bulls can hold their ground.


