
- Solana surged 18% in under a week, reclaiming $180, but trading volume dipped 10% as some traders locked in profits.
- On-chain data shows $15.18M in exchange inflows and strong bullish dominance, with $184 as the critical resistance to break.
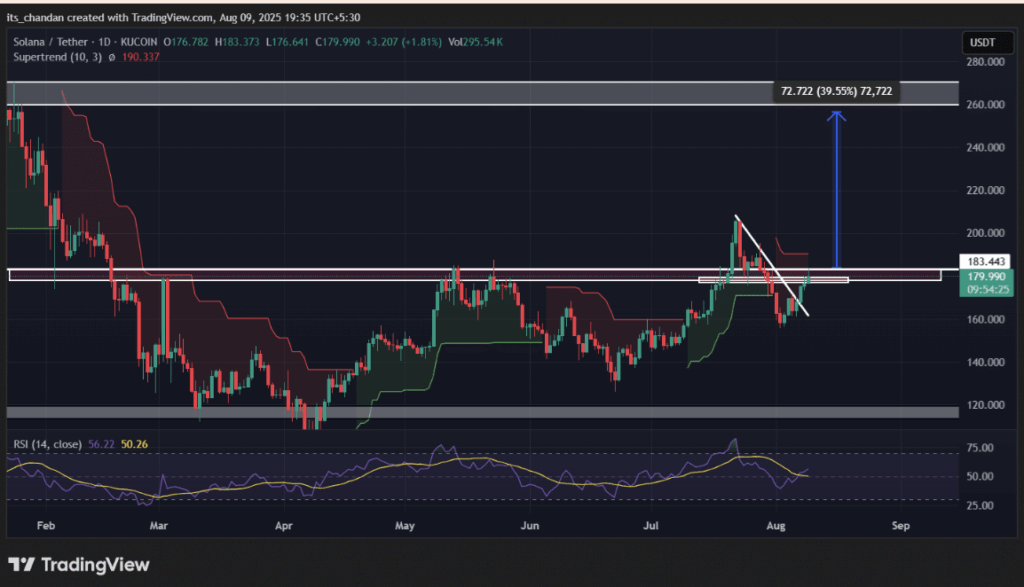
- A daily close above $185 could open the path toward $256, though sellers remain active with the Supertrend still signaling a downtrend.
Solana’s had quite the week—jumping 18% in under seven days and reclaiming that $180 territory traders had been eyeing for a while. On August 9th, it ticked up another 3% in just 24 hours, hitting around $181, marking three straight days of green. Naturally, the move has fueled talk of more upside, but also triggered some profit-taking from those who don’t want to push their luck.
Interestingly though, trading volume didn’t follow the same trajectory. CoinMarketCap data shows a 10% drop in 24-hour volume despite the price rally. That dip hints that some traders are sitting out until the next clear move—possibly wary after past volatility, or just cashing in on short-term gains before the next test.
Mixed On-Chain Signals Suggest a Tug of War
CoinGlass data recorded $15.18 million flowing into exchanges on August 9th. That kind of inflow, especially during a rally, can be a warning sign that holders are getting ready to sell into strength. On the flip side, liquidation maps show a $174 support level holding strong and a clear resistance ceiling sitting just under $184.
Long positions heavily outweigh shorts right now—$436.74 million versus just $23.79 million—indicating bullish dominance. Still, that $184 mark is emerging as the real make-or-break point for whether this run keeps climbing or stalls out.
The Technical Picture: Key Levels in Sight
From a chart perspective, Solana’s breakout above its descending trendline is what really kicked this rally into gear, and it’s been riding broader market optimism ever since. The RSI is sitting around 57, comfortably below overbought territory, so there’s still room to run. But here’s the catch—closing above $185 is essential for any realistic shot at that $256 target (about a 40% upside from here).
The Supertrend line at $190.33 is still in a downtrend mode, which means sellers haven’t left the building just yet. If momentum fades before breaking through $185, we could see a pullback or sideways drift before another real attempt.