- Solana jumped 12% following Trump’s 90-day tariff pause, but technical indicators like RSI and BBTrend still suggest bearish momentum hasn’t gone away.
- RSI remains under 50, showing weak buyer conviction, and BBTrend is at its lowest level since March—both hinting at possible further downside unless bulls show up strong.
- If SOL fails to hold above $100, it could revisit $95 or even dip below $90, unless there’s a strong shift in sentiment or buying volume soon.
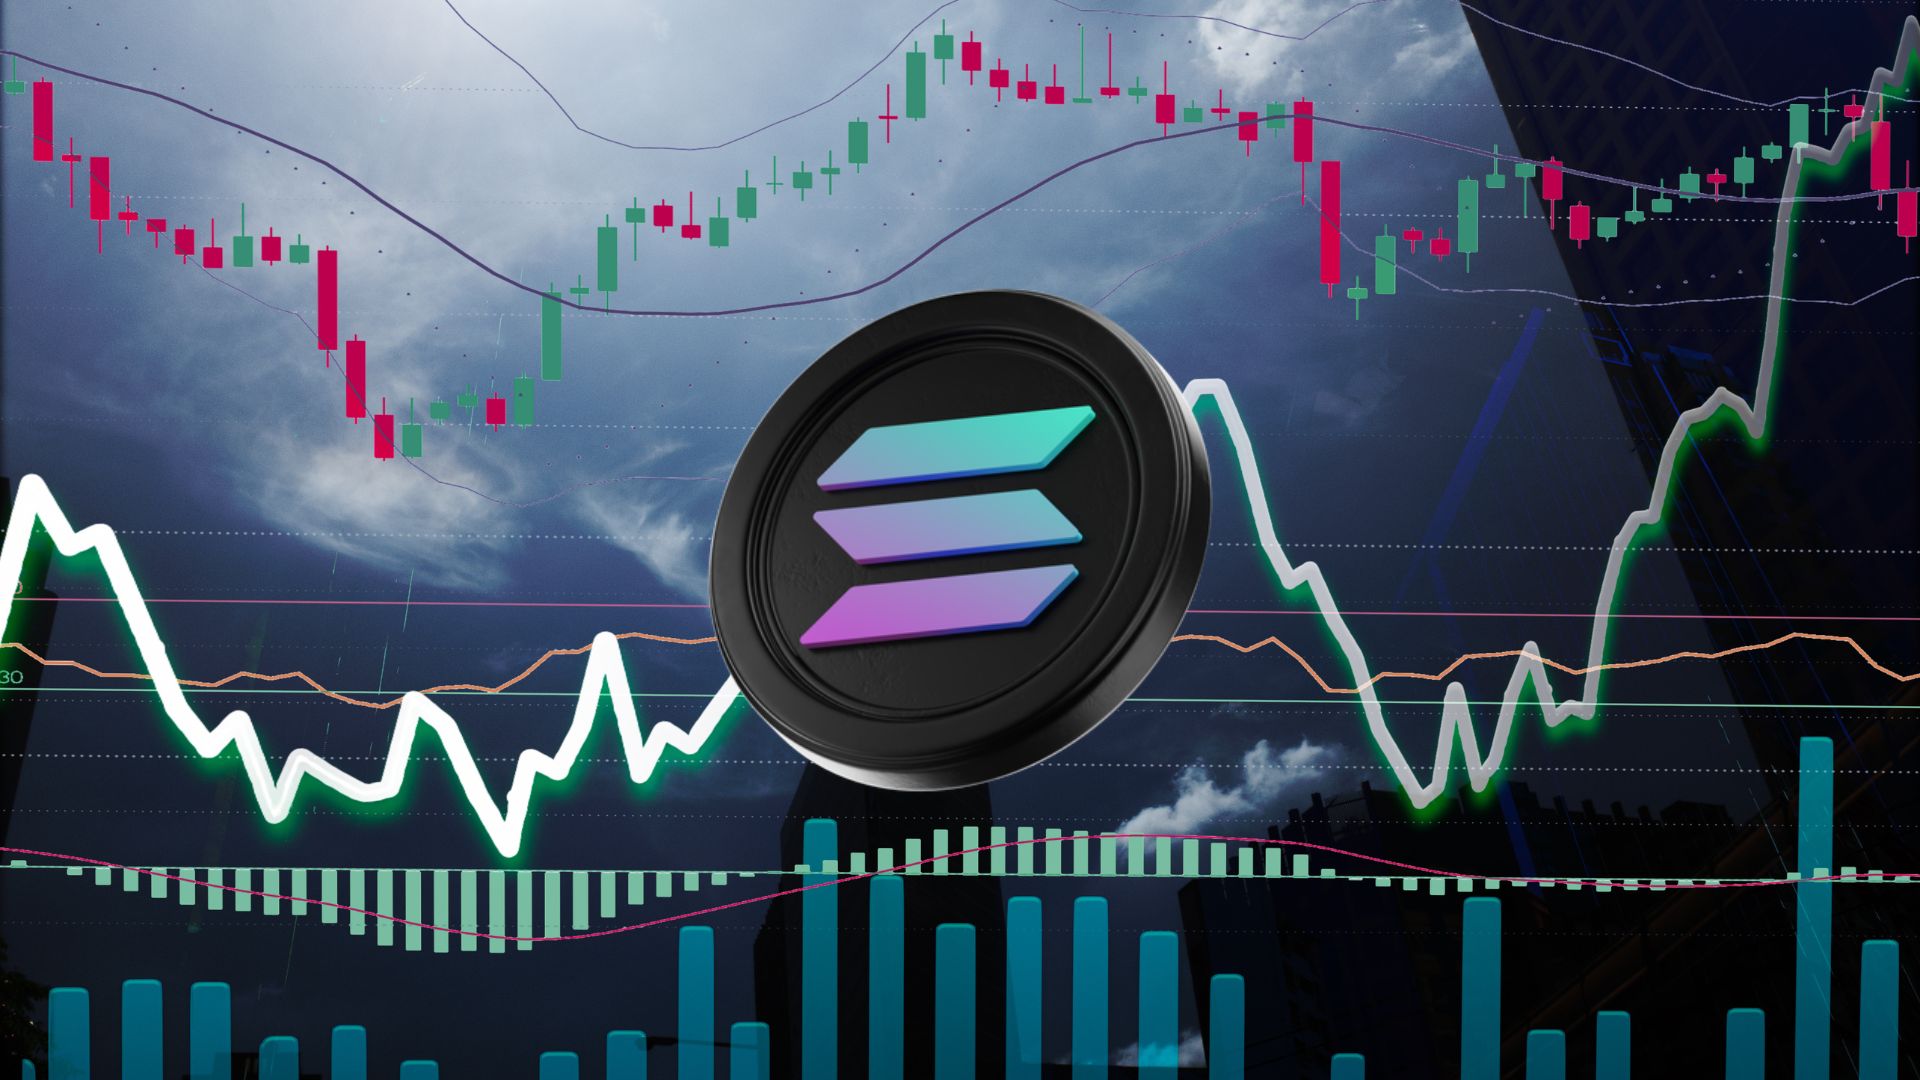
Solana (SOL) saw a sharp 12% rebound today, riding high off the news of a 90-day tariff pause announced by former President Trump. On the surface, it looked like a strong recovery. But dig just a little deeper, and things aren’t quite as rosy. Technical signals are still flashing red, and there’s this nagging question hanging in the air: Is the rally already running out of gas?
RSI Says: Buyers Still Seem… Unsure
Let’s talk RSI—Solana’s Relative Strength Index is currently hovering around 45.52. Not terrible, but also not great. It’s stuck in this limbo zone, below the neutral 50 mark, and it’s been stuck there for the past two days.
Just two days ago, it was scraping the bottom at 21.53—an oversold reading that basically screamed, “Sellers took over!” But now? It’s trying to claw back up, slowly. The fact that it hasn’t bounced harder might mean buyers aren’t really stepping in with confidence just yet.
If it doesn’t break past 50 soon, we might just be looking at a stall—or worse, another slide back down.
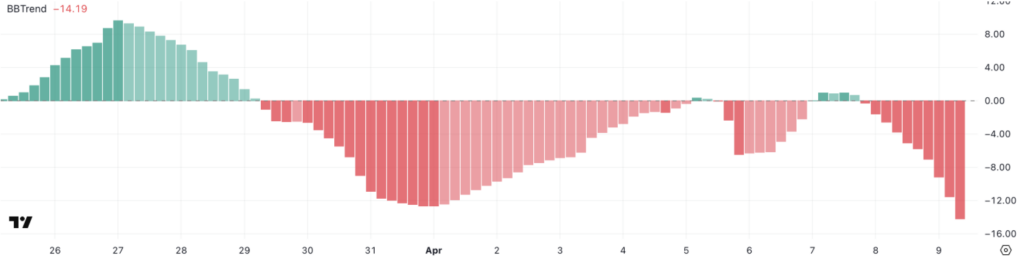
BBTrend Dips to Its Lowest Since March—Bear Pressure Mounts
Now here’s the more worrying bit: the BBTrend (that’s Bollinger Band Trend, for the less chart-savvy) has dropped to -14.19. That’s the lowest it’s been since mid-March, and yeah—it’s kind of a big deal.
BBTrend turning this negative means bearish momentum is picking up again. It’s not just a little dip—it’s a signal that sellers are pressing harder, and the floor might not hold if bulls don’t show up soon.
When this indicator dips that far, historically it doesn’t just snap back up. It usually gets worse before it gets better—unless volume pours in and sentiment flips fast.
Below $100 Again? It’s Not Off the Table
From a price structure perspective, Solana’s still in rough waters. The EMA setup isn’t exactly inspiring confidence. Short-term moving averages are sitting well beneath the longer ones—a textbook bearish layout. That tells us the trend is still down, regardless of today’s bounce.
If SOL can hold above $108 and push toward $120, we might see it challenge the $134 zone again. But that’s a big if.
If things tilt bearish again, we’re likely staring at a revisit to $95. And if that breaks? A drop below $90 isn’t out of the question. That level hasn’t been seen since January, and it’d be a pretty big psychological hit.
Final Thoughts
Sure, Solana popped off the back of some political headlines—but the chart is still showing cracks. Momentum indicators are shaky, bearish trends are sticking, and confidence among buyers is… well, let’s just say “cautious” at best.
It’s one of those times where short-term traders might enjoy the bounce, but long-term holders should keep their seatbelts fastened. April’s not done with us yet.