- Solana Hits 4-Month Lows: SOL has dropped 5% in the past 24 hours, extending its 45% monthly correction, with its market cap down to $70 billion.
- Technical Indicators Remain Bearish: The Ichimoku Cloud and EMAs confirm strong selling pressure, with no clear signs of reversal as SOL struggles below key levels.
- Key Support Levels at Risk: If $133 support fails, SOL could slide to $120 or even $110, its lowest price since August 2024, unless whale accumulation picks up.
Solana’s downtrend isn’t slowing down. Currently trading at its lowest level in four months, SOL has dropped 5% in the last 24 hours, extending its brutal 45% correction over the past month. This decline has dragged SOL’s market cap down to $70 billion, reinforcing the bearish momentum seen in technical indicators like the Ichimoku Cloud and EMA trends.
Ichimoku Cloud Paints a Bleak Picture
Solana’s Ichimoku Cloud setup screams bearish. Price remains far below the cloud, signaling strong downward pressure. The red cloud ahead further confirms bearish sentiment, with Leading Span A (green) trailing under Leading Span B (red)—a clear sign that the negative trend is likely to continue.
Adding to the pressure, the Tenkan-sen (blue) is positioned beneath the Kijun-sen (red), reinforcing selling dominance. Meanwhile, the Chikou Span (green lagging line) is also below price action, suggesting no signs of a trend reversal yet.
A brief consolidation attempt failed to spark a recovery, and SOL dipped again. While the price appears to be stabilizing, the bearish structure remains intact. For any chance of a reversal, SOL needs to break above the Tenkan-sen and Kijun-sen, then push through the Ichimoku Cloud. Until then, the bears remain in control.
Solana Whales—Dumping or Accumulating?
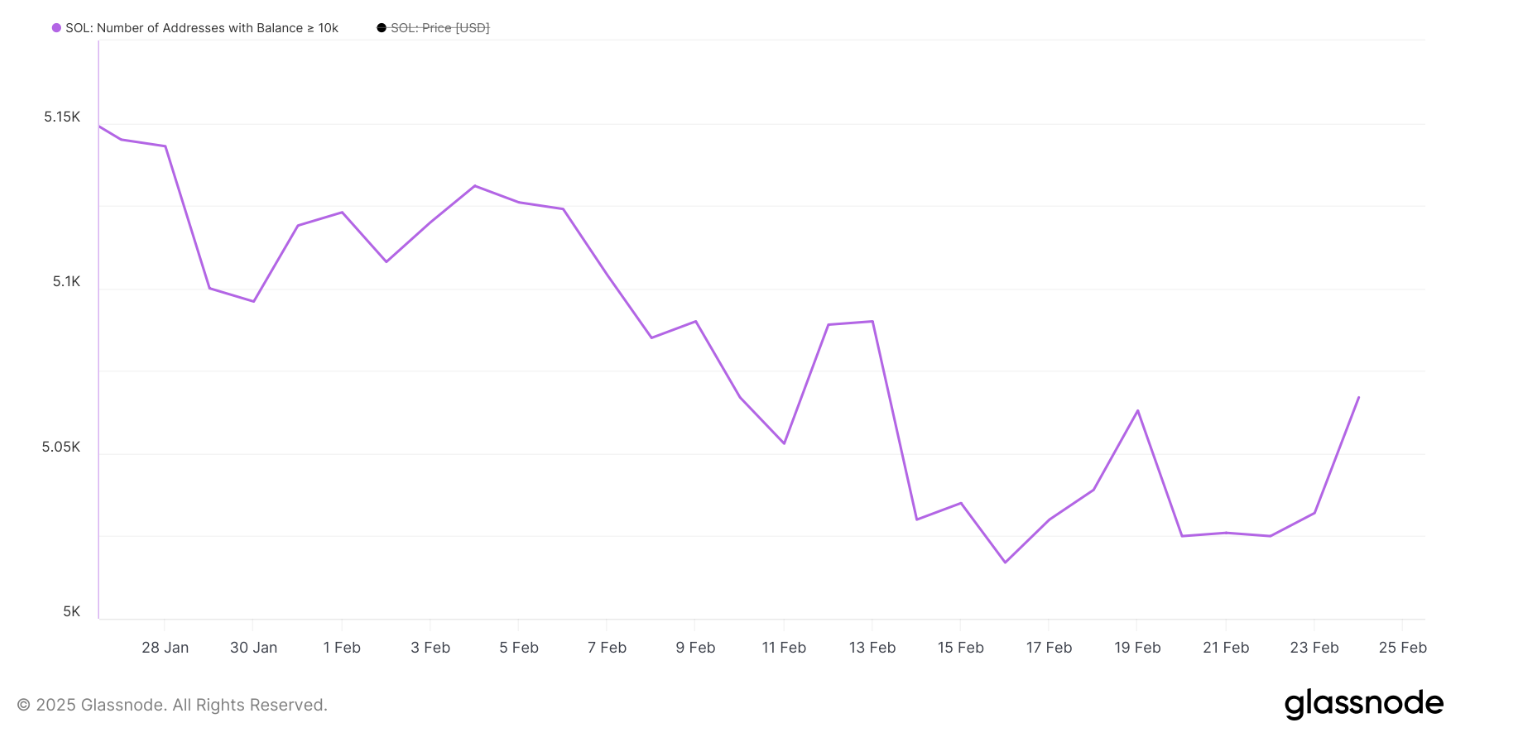
The number of Solana whales (wallets holding at least 10,000 SOL) has been steadily declining over the last 30 days, hitting 5,017 on February 16—the lowest count since December 2024. This drop indicates that large holders have been selling, adding to the selling pressure reflected in the Ichimoku Cloud.
When whales reduce their positions, the market often follows. Their actions can significantly influence price movements, as they control a large portion of SOL’s supply.
However, there’s a small sign of hope. Recently, whale numbers inched back up to 5,067, showing some cautious accumulation. That said, this is still lower than recent months, meaning the market remains fragile and uncertain. While whales may be slowly re-entering, it’s not yet enough to flip the bearish outlook.
How Low Can SOL Go?
SOL’s Exponential Moving Averages (EMAs) are signaling deep trouble. Short-term EMAs remain below long-term ones, with a wide gap reinforcing strong bearish momentum. If this trend holds, SOL could soon test support at $133.
If $133 fails, SOL may slide to $120, and in a worst-case scenario, it could dip as low as $110—levels not seen since August 2024.
This widening EMA gap aligns with the bearish sentiment from the Ichimoku Cloud, making it difficult for buyers to regain control anytime soon.
Final Thoughts—What’s Next for SOL?
Solana’s current trajectory remains bearish, with technical indicators showing no immediate recovery signals. If whale accumulation continues, it could provide some support, but as of now, the market remains in a downtrend.
To shift momentum, SOL needs to break above key resistance levels, starting with $140–$145. Until that happens, the path of least resistance is still downward, and traders should brace for potential deeper losses.