- Solana is trading near $84 with rising volume, but the weekly trend remains slightly negative.
- Strong resistance at $89–$90 continues to reject upside attempts, forming lower highs within the range.
- Key support sits near $75–$77, with deeper correction risk if that level fails.
Solana is hovering near $84.32 after clawing back roughly 2.6% over the past 24 hours. On paper, that bounce looks constructive. But zoom out to the weekly chart and the tone shifts — the broader trend is still slightly negative, reflecting hesitation more than conviction. Traders aren’t exactly rushing in.
What stands out more than the price itself is the activity behind it. Trading volume jumped over 26%, pushing 24-hour turnover close to $4.67 billion. That kind of spike during sideways movement usually means participants are reacting to key levels, not building long-term positions. It’s engagement, yes. Commitment? Not quite.
$90 Remains the Line in the Sand
The $89–$90 region has once again acted as a ceiling. According to CryptoPulse, that zone continues to reject price attempts with consistency. Each time SOL approaches it, sellers step in almost immediately.
That repeated rejection matters. If price cannot close convincingly above $90, the short-term bearish structure remains intact. Markets don’t need dramatic selloffs to stay weak — sometimes all they do is fail to break higher.
The pattern developing is classic consolidation. Buyers push upward, sellers respond near resistance, and the asset falls back into range. It’s controlled tension. But tension nonetheless.
Lower Highs Tell a Subtle Story
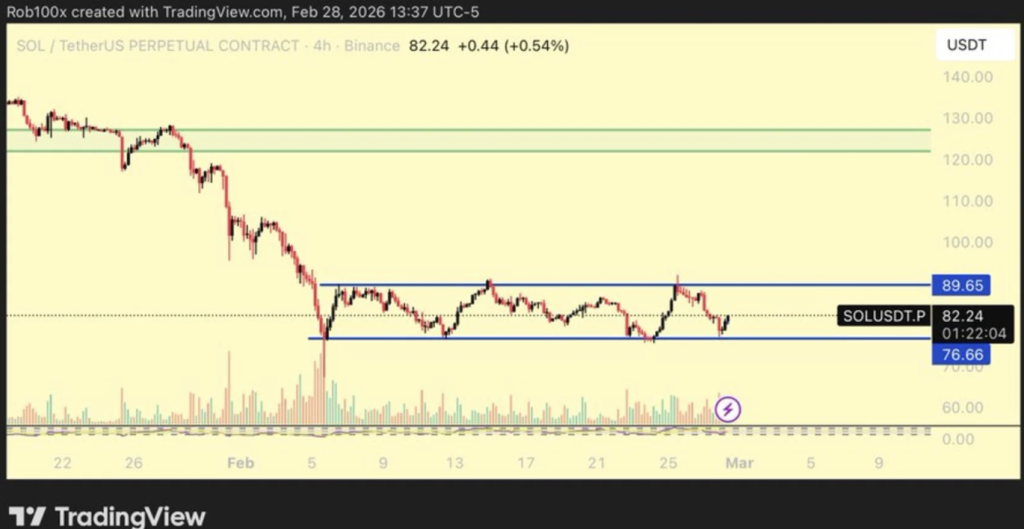
On the chart, SOL appears trapped between $75–$77 on the downside and $89–$90 on the upside. Demand has consistently shown up near the lower boundary. That floor has held — for now.
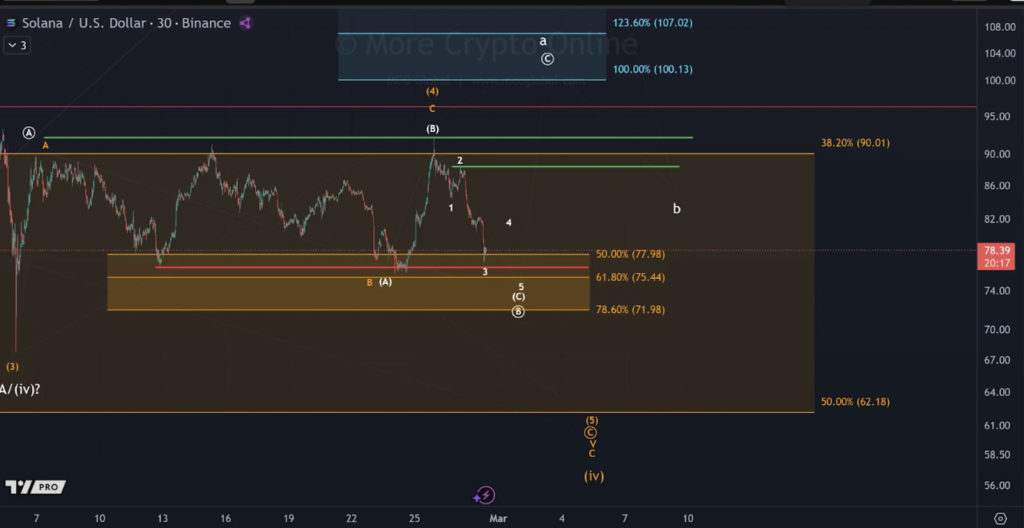
However, recent price swings are forming lower highs within the range. That detail is easy to overlook, but it signals fading upside momentum. Each rally attempt is slightly weaker than the last. That’s not what strong breakouts are made of.
More Crypto Online pointed out that downside pressure still lingers beneath the surface. Bulls have defended the lower boundary repeatedly, but the pattern hasn’t yet shown a clean transition into sustained strength. Stability feels fragile.
Correction Signals and Key Risk Levels
Short-term indicators suggest that SOL may still be in a corrective phase. Price briefly pushed toward $90–$92 but was rejected quickly, reinforcing the idea that sellers are defending that zone aggressively.
Trader Rob outlined a more tactical approach — acknowledging visible buying interest but placing risk controls below the $76 low. His upside targets sit at $89, then $100, and potentially $125 if momentum returns in force. That’s a big “if.”
Fibonacci retracement levels align closely with the $78 and $75 zones. The $75.44 region, in particular, appears to represent deeper corrective territory where liquidity could build. If SOL slips below that level, selling pressure may accelerate. Until then, the market remains caught between defense at the bottom and rejection at the top. Not broken. Not bullish. Just waiting for a decisive move.