
- Solana has printed a TD Sequential buy signal while hovering above crucial support around $150, with on-chain data highlighting $147.49 as its most important demand zone.
- At roughly $167, SOL is testing resistance near $164.73, with support around $158.14 and potential downside toward $140 if these levels fail to hold.
- MACD shows a bearish crossover and RSI sits near 40, signaling weak momentum and aligning with the idea that Solana needs stronger bullish pressure before any meaningful rebound can really take off.
Solana has pushed itself back into the spotlight, again, as one of the strongest large-cap altcoins. After a strong run, it’s now at that tricky stage where momentum is slowing, but the chart still looks alive enough to tempt dip buyers. Analyst Ali (@ali_charts) highlighted a fresh TD Sequential buy signal on SOL, paired with an important support zone around $150, and that combo has traders watching the chart a lot closer than usual.
Even though buyers are still struggling a bit to fully regain control, there are early hints of a possible rebound in the technicals. This doesn’t mean “guaranteed bottom” of course, but it does suggest that Solana is approaching one of those make-or-break zones where trend direction can flip fast. If bulls manage to defend these levels, the current pullback could end up being just another pause in a larger uptrend rather than the start of a breakdown.
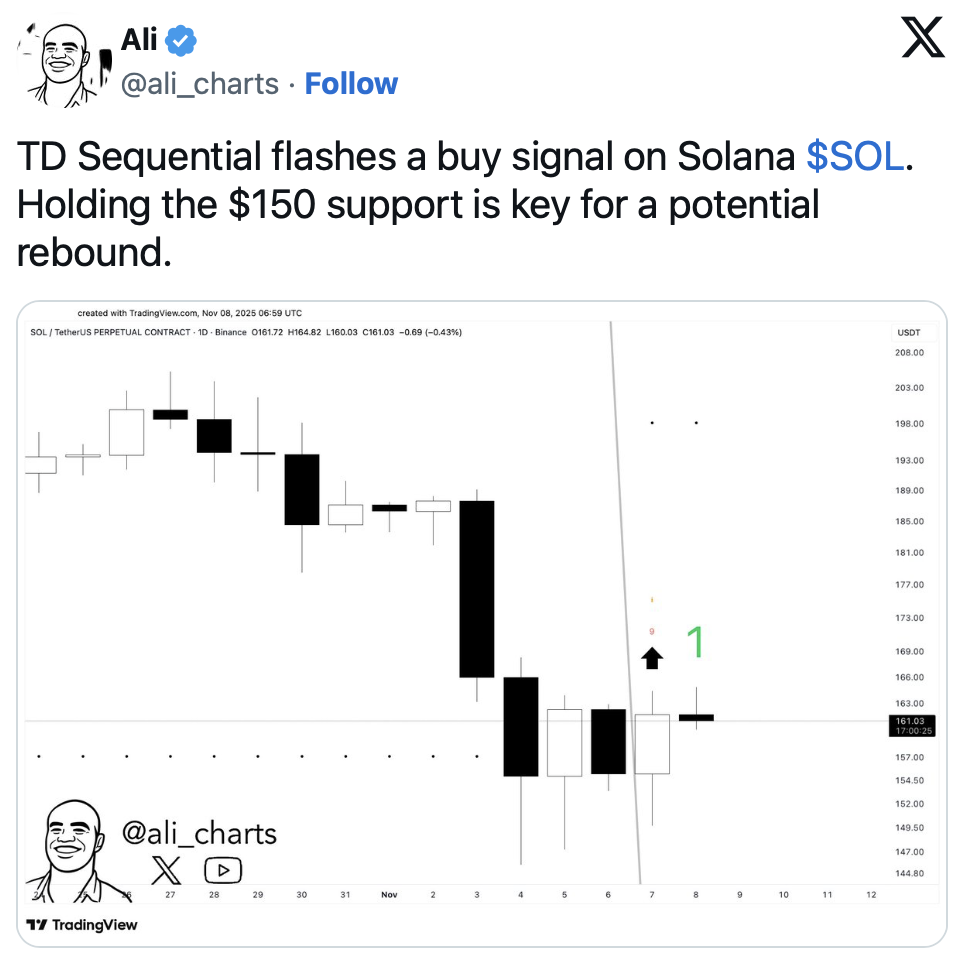
TD Sequential flashes a buy setup around $150
Ali’s analysis points out that Solana has triggered a TD Sequential buy signal, a tool traders often use to spot potential reversal points after extended downside or exhaustion. In simple terms, it’s the market’s way of saying: “Hey, this move down might be running out of steam.” But the signal doesn’t work in a vacuum; it needs price to respect certain levels.
According to his chart, SOL needs to hold above the critical $150 area to give that TD buy signal real teeth. If buyers manage to defend this zone and push price higher from there, it strengthens the argument for a rebound and continuation of the broader uptrend. But if Solana breaks down clearly below that level, the signal can be invalidated pretty quickly, turning what looked like a bounce setup into a warning of deeper weakness instead. So yeah, $150 isn’t just a random number, it’s sort of the line in the sand right now.
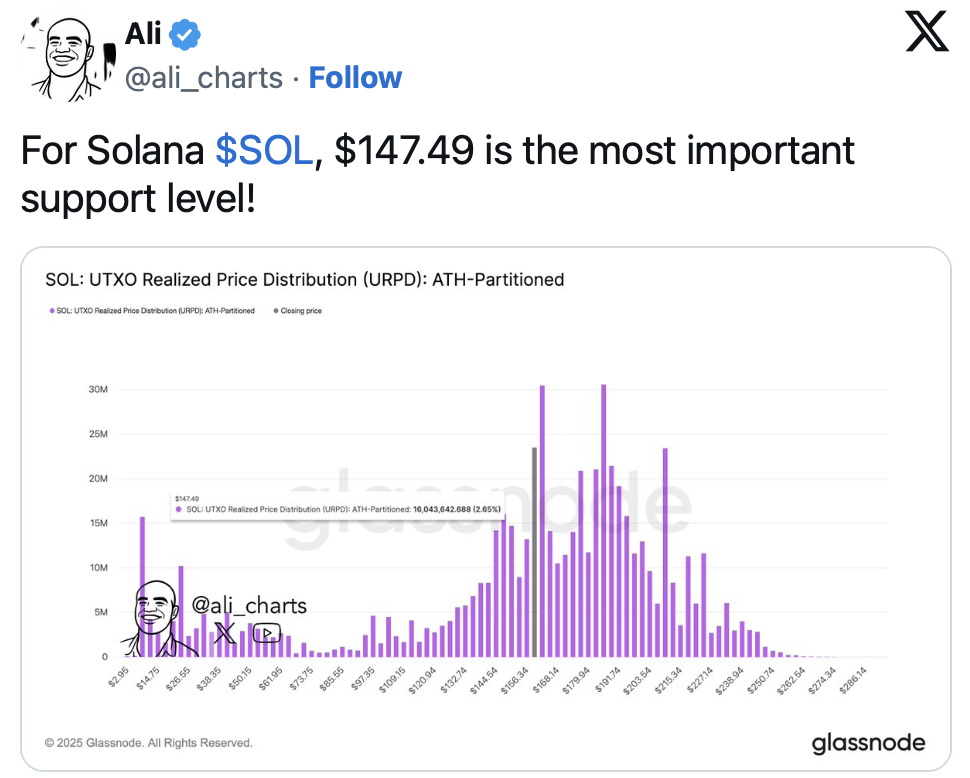
$147.49 stands out as the most important on-chain support
Digging deeper, Ali also flagged $147.49 as Solana’s most critical support based on on-chain realized price data. His URPD chart shows a big cluster of accumulated SOL sitting around that region, meaning a lot of buyers previously entered around those prices. That creates a kind of “ownership wall” where holders are more likely to defend their entries rather than let price sink without a fight.
Because of that, the $147.49 zone becomes more than just a chart line; it’s a psychological and structural area where bulls really need to show up. Holding above this level keeps the bullish structure intact and reinforces the idea that current weakness is just temporary noise. But if SOL decisively loses that zone, it opens the door to a steeper downside move, as there’s less historical demand to naturally catch the fall. In other words, keep one eye on $150, and the other right on $147.49.
Key levels: resistance, support, and possible paths
From a broader market perspective, Solana is still one of the top altcoins by size. With a market cap around $92.83 billion and roughly $5.57 billion in 24-hour trading volume, it’s far from a low-liquidity play. At press time, SOL is trading near $167.69, up about 5.37% in the last day, which shows there’s still plenty of interest on both sides of the order book.
Price action right now is leaning bullish overall and is testing a resistance area near $164.73. If SOL can break and hold above this resistance, the next logical target sits around the $170 region, which could act as the next checkpoint for bulls. On the flip side, nearby support comes in around $158.14. A clean break below that could drag price toward the $140 area, especially if the broader market mood turns risk-off again. The blue line on the chart marks that $164.73 resistance, while the yellow line marks the $158.14 support, giving traders a clear short-term range to watch.
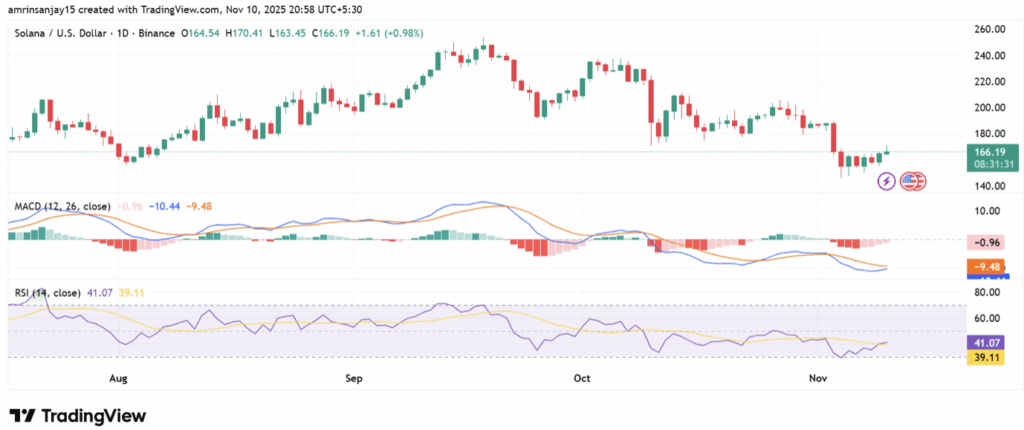
Weak momentum: bearish MACD and soft RSI readings
Despite the TD buy signal and those key supports, momentum itself still looks pretty soft. The MACD on Solana’s chart is currently showing a bearish crossover, with the signal line sitting above the MACD line. That setup usually suggests that downward pressure could continue for a bit, or at least that upside moves may struggle to follow through strongly. The blue line represents the MACD, and the orange line is the signal line, and right now that relationship isn’t exactly screaming strength.
The RSI doesn’t look too pretty either. Readings around 41.07 and 39.11 reflect mild bearish momentum — not oversold, but definitely leaning cautious. It’s the kind of zone where price can drift lower or chop sideways if buyers don’t step up with conviction. This lines up with Ali’s broader view: Solana is weakening in the short term and needs a stronger wave of bullish pressure before it can launch a convincing rebound.
So, at this stage, the story is a mix of warning and opportunity. Momentum is weak, MACD is bearish, RSI is soft, but Solana is also sitting near deeply important support zones that have historically attracted heavy buying. If those areas hold, the TD Sequential signal may end up marking a key turning point. If not, traders might need to brace for a deeper reset before SOL can attempt another serious leg up.