- Solana’s TVL Drops 30%: Currently at $10.3B, recovering from a $9.90B low, but still far from January’s $14.2B, signaling weakened investor confidence.
- Bearish Momentum Weakening: Ichimoku Cloud & DMI indicators show selling pressure fading, with buying momentum rising—a potential trend reversal forming.
- Key Levels to Watch: SOL must break $183 to signal a bullish recovery; failure could lead to a drop toward $159 or even $147, its lowest since October 2024.
Solana’s Total Value Locked (TVL) recently fell to $9.90 billion, its lowest level since November 2024, before rebounding slightly to $10.3 billion. Despite this bounce, SOL’s TVL is still down nearly 30% from its January peak, sparking concerns about its ecosystem stability.
Meanwhile, SOL’s price has taken a hit, down 8% in the past week and over 31% in the last month. Some technical indicators hint at recovery, but bearish momentum still dominates as SOL remains trapped below key resistance levels.
TVL at Historic Lows—What’s Driving the Decline?
Solana’s TVL sits at $10.3 billion, recovering slightly from a low of $9.90 billion on February 17—the weakest level since November 14, 2024. However, TVL remains nearly 30% below its January high of $14.2 billion, suggesting a decline in investor confidence.
This drop aligns with ongoing controversies in the Solana ecosystem, such as:
- Accusations of extractive tokenomics.
- Criticism over the launch of the meme coin LIBRA, which may have triggered capital outflows.
Since TVL measures the total capital locked in DeFi protocols, its decline suggests a shrinking liquidity base and weaker investor confidence. If Solana fails to address these issues, capital outflows could continue, exerting downward pressure on SOL’s price. On the other hand, a resurgence in TVL could be a bullish signal, indicating renewed investor interest.
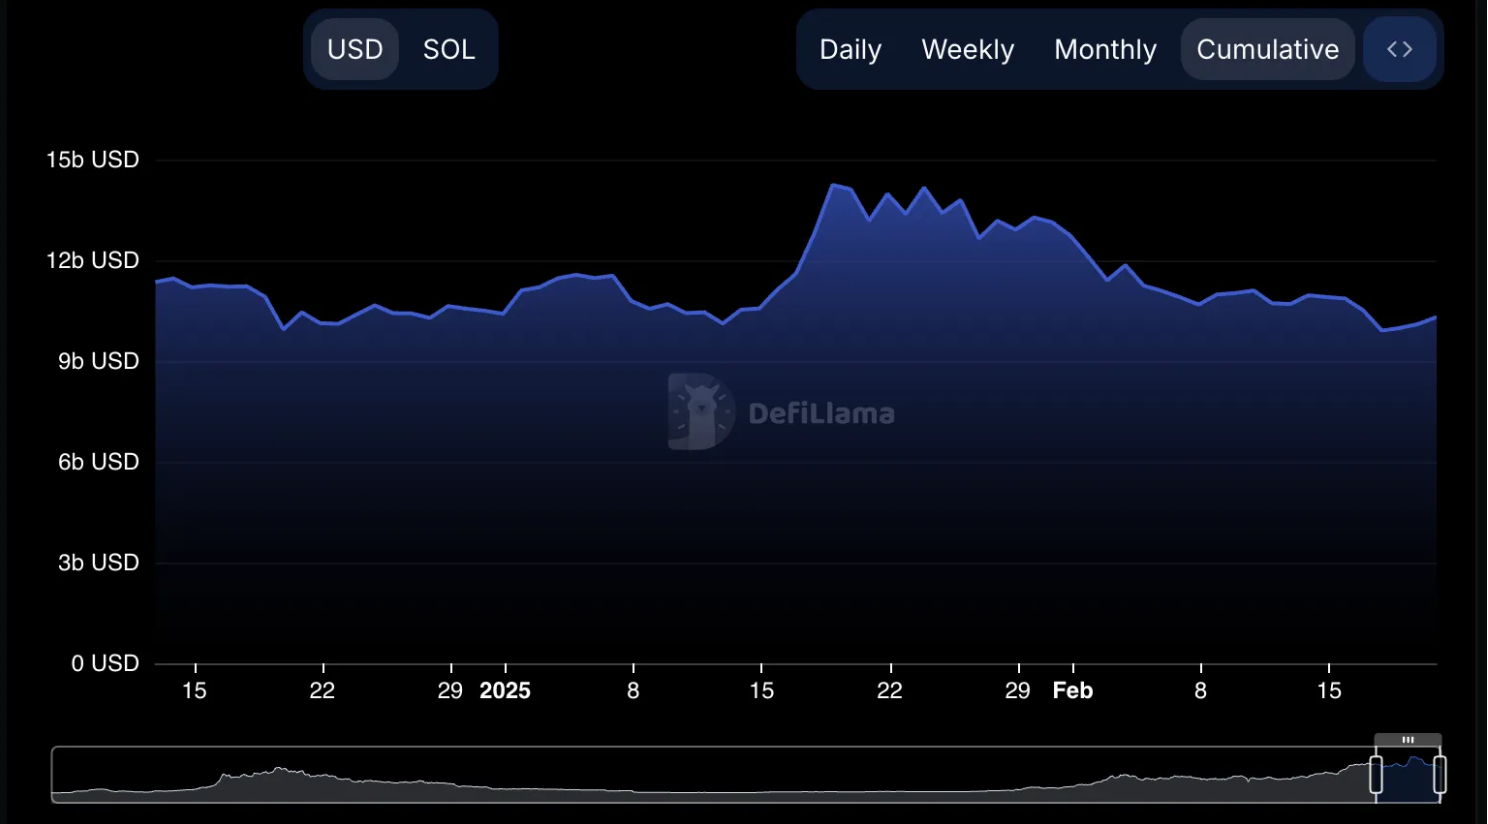
source: DeFiLlama
Bearish but Recovering? SOL’s Technical Indicators
Solana’s Ichimoku Cloud chart shows that SOL remains below the red cloud, reinforcing a dominant bearish trend. However:
- Price is trading above the Tenkan-sen (blue) and Kijun-sen (orange), suggesting some weakening in bearish momentum.
- If SOL breaks above the red cloud, it could signal a shift toward bullish momentum.
- Failure to do so would likely see renewed selling pressure.
Directional Movement Index (DMI) Shows a Shift in Momentum
- ADX has dropped to 25.4, down from 43 just two days ago when SOL dipped to $165.
- +DI is rising (now at 18.4), while -DI is dropping (now at 14.8)—this suggests buying pressure is increasing as selling pressure weakens.
- If +DI crosses above -DI, it could confirm a trend reversal. However, if +DI fails to maintain its momentum, SOL might continue its downtrend.
Can SOL Reclaim $200?
SOL’s Exponential Moving Averages (EMAs) are still bearish, with short-term EMAs lagging behind long-term ones. But there’s a shift happening:
- SOL price climbed 4% in the last 24 hours, hinting at weakening selling pressure.
- If short-term EMAs cross above long-term EMAs, it could confirm a bullish reversal.
Key Levels to Watch:
- Resistance: First target at $183—breaking past this could pave the way for $197.
- Bullish Scenario: If buying momentum continues, SOL could push toward $220, signaling a strong recovery.
- Bearish Scenario: If selling pressure returns, SOL may retest $159. A breakdown here could lead to $147, its lowest level since October 2024.
Final Thoughts—Will SOL Recover or Keep Sliding?
- TVL drop signals weaker investor confidence, but a bounce could reignite bullish sentiment.
- Technical indicators show mixed signals, with momentum shifting but resistance levels still intact.
- Key price levels at $183 and $197 will determine whether SOL breaks out or remains under pressure.
For now, traders are watching closely—will Solana fight back, or is there more downside ahead?