- SOL dipped below key $114 support, signaling a potential continuation of its downtrend toward the $77 level if it can’t reclaim lost ground soon.
- Technical indicators show strong bearish pressure, with RSI near oversold and SOL trading under the 200-day EMA.
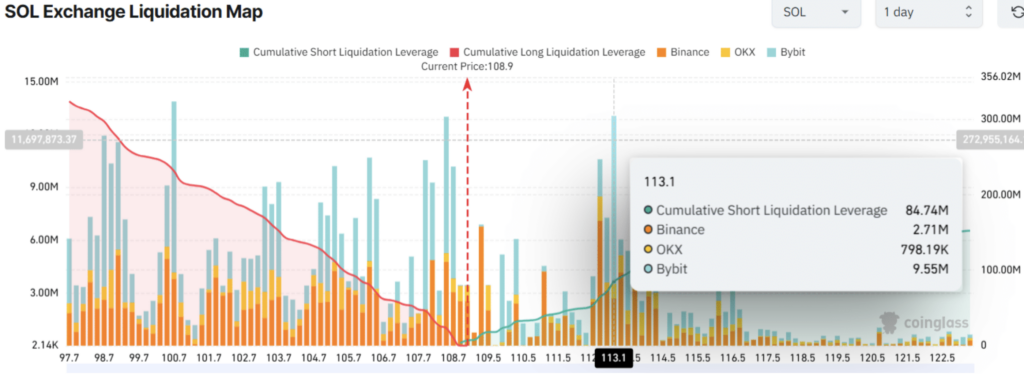
- On-chain data confirms trader sentiment is bearish, with more short positions than longs and heavy leverage clustered around key resistance and support zones.
Solana’s been having a rough go lately.
Even after bouncing up 10% from around $97 to hover near $108.50 at press time, the sixth-largest crypto by market cap still looks like it’s stuck in a downtrend. Trading volume’s up about 25% too, so clearly, folks are paying attention—but not necessarily in a good way.
That $114 Breakdown—Not a Great Sign
According to AMBCrypto’s chart analysis, SOL broke down past a key support level of $114 back on April 6. That zone has been a strong rebound point since March 2024—but this time? No dice. The daily candle closed under $114, which historically points to more downside incoming. Oof.
And if SOL doesn’t reclaim that level soon? Based on past patterns, we could be looking at another 30% slide, which brings the next meaningful support to somewhere around $77.
Right now, SOL is trading well beneath its 200-day EMA on the daily chart, which usually signals sustained bearish momentum. Basically, the bulls are taking a nap.

RSI Dipping, Bears Gripping
The Relative Strength Index (RSI) is flirting with oversold territory, which tells us there’s heavy selling going on—and it’s not slowing down just yet.
So yeah, it’s not all sunshine and rainbows in SOL land.
Traders Betting on More Pain
Over on the on-chain side, things aren’t looking much better. Coinglass data shows traders are leaning bearish even after the recent price bounce. The Long/Short Ratio is sitting at 0.95, which means there are slightly more short positions than long—never a super bullish sign.
To make it worse, traders have built about $23.2 million in long positions right around that $108.50 level. If price keeps sliding, those could get wiped. On the flip side, there’s a heavy stack of shorts—about $85 million worth—sitting just above at $113.10, another red flag showing where traders are expecting resistance.
Liquidation Watch: It’s a Tense Setup
This tug-of-war between shorts and longs means one thing: a big move in either direction could lead to liquidations. It’s a pressure cooker waiting for a trigger.
So, while bulls might be hoping this little 10% rebound means things are turning around, the charts and on-chain data say otherwise—for now, at least.


