- Solana failed to hold breakout levels, signaling weakness in the current trend
- Technical indicators show growing bearish momentum on lower timeframes
- Key levels at $83 and $79 may determine whether SOL bounces or breaks lower
Solana hasn’t had the easiest few weeks, and it’s starting to show. When Bitcoin pushed up toward $76K around mid-March, SOL actually looked like it might follow through, breaking out of a range it had been stuck in since early February. For a moment, momentum was there, volume picked up, and it felt like bulls might finally take control.
But that optimism didn’t last long. The failure to hold above the $89.9 range highs turned out to be an early warning sign, though maybe not everyone caught it at the time. What looked like a breakout ended up being more of a fake move, and price has since slipped back into familiar territory.
Bigger Picture Still Shows Weakness
Looking at the daily chart, that range wasn’t exactly strength, it was more like a pause after a sharp downtrend. Even though the OBV showed signs of accumulation during that phase, suggesting some buying interest, it wasn’t enough to shift the overall structure.
The RSI held above 50 for a while, hinting that momentum might sustain, but zoom out and you see the bigger obstacle. The $105 to $120 zone above remains heavy with supply, and recent attempts couldn’t even push past $100. That alone says a lot about how strong resistance still is.
Short-Term Trend Turns Bearish Again
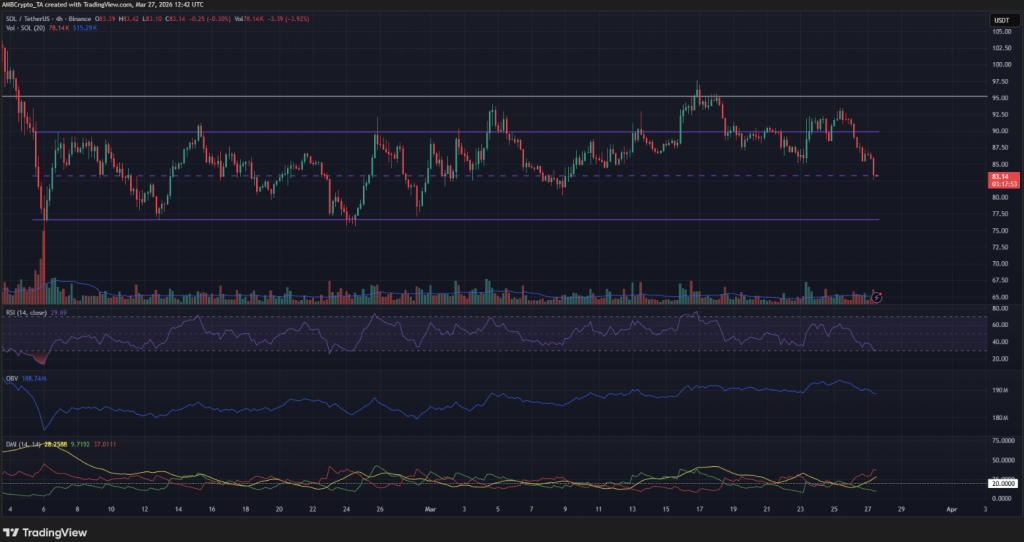
On the lower timeframe, things look a bit more fragile. The range between $76.6 and $89.9 is still intact, with the midpoint around $83.3. Right now, SOL is trading just below that level, which isn’t exactly where bulls want it to be.
Indicators aren’t helping either. The DMI shows a clear downtrend in progress, while the RSI is drifting closer to oversold levels. The OBV is also nearing new local lows, reflecting the steady selling pressure over the past several days. It’s not panic selling, but it’s consistent enough to matter.
Mid-Range Offers Unclear Opportunities
There’s still a chance of a bounce from this area, technically speaking. Mid-range levels can sometimes act as temporary support, especially if buyers step in. But trading from the middle of a range is tricky, and often less reliable than entries at the extremes.
Given the current sentiment, it’s hard to justify aggressive long positions here. The setup just isn’t clean. If anything, it feels like a waiting game, watching to see if price moves toward either edge of the range before making a clearer decision.
Liquidity Zones Could Shape the Next Move
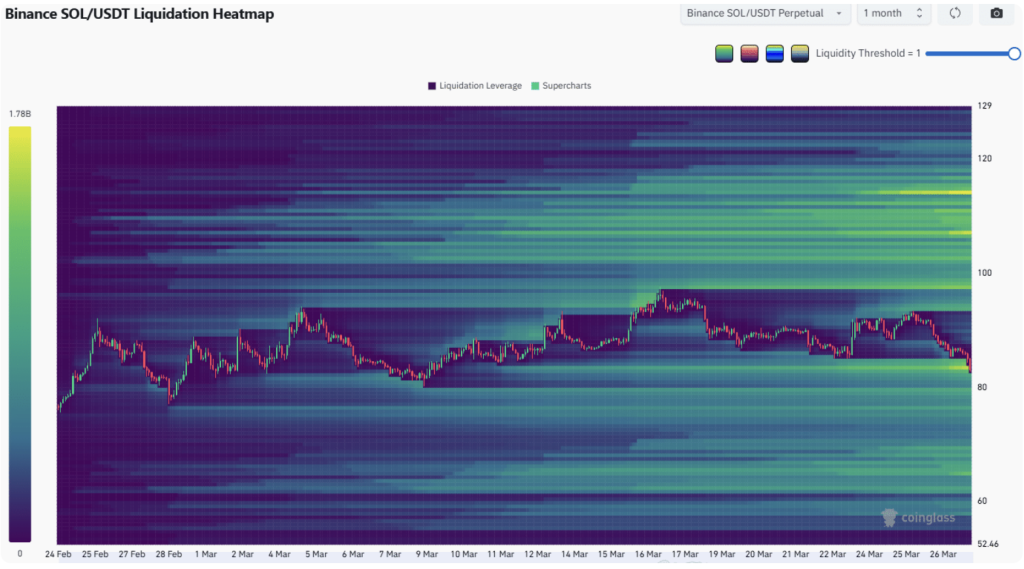
The liquidation heatmap adds another layer to the story. Recent Bitcoin weakness dragged SOL into a liquidity pocket around $83, where price tends to get pulled toward clusters of positions. Below that, there’s another zone near $79, just under previous lows.
This creates a scenario where price could dip further, sweep that liquidity, and then attempt a bounce. For any real confidence in a short-term recovery, traders would want to see SOL reclaim the $83 to $85 area first.
If that happens, a move toward $94 to $98 isn’t out of the question, especially if short liquidations start getting triggered. But until then, the structure leans cautious… maybe even slightly bearish.