- Solana is testing its first major support zone at $145–$150, but weakening volume and softer reactions suggest buyers aren’t defending it as strongly as before.
- Analysts warn of a possible head-and-shoulders breakdown toward the $120–$125 neckline, with deeper targets near $81 if selling pressure accelerates.
- Despite the bearish chart structure, SOL ETFs continue showing steady inflows, hinting that institutions are accumulating even as price action remains corrective.
Solana slipped back toward a pretty important support pocket around $144, a level traders have been watching closely after the token dropped almost 6% in 24 hours… and nearly 29% in a month. The chart has been grinding lower, and analysts are kinda split on whether buyers still have enough strength to hold the line—or if SOL might be headed for a deeper demand zone below.
Solana Price Grinds Into First Support Zone
SOL drifted toward the $145–$150 range again, a region that sparked pretty sharp bounces in the past. But this time, the reaction looked softer. Candles shrank, volume thinned out, and momentum felt slower than usual. Basically, short-term buyers weren’t jumping in with the same enthusiasm.
One analyst called this the first “real” support for the current structure. Beneath that sits the wider $118–$125 block, which previously launched a strong reversal. The gap between the two zones makes this moment kinda high stakes for traders.
If bulls lose the upper support, Solana could slide fast toward the deeper pocket, especially since liquidity looks lighter down there. Still, a controlled move into this area could just be a normal pullback inside a bigger uptrend, while a sharp breakdown would tilt the whole chart into a broader correction.
SOL Faces Pattern Risk and Heavy Resistance Overhead
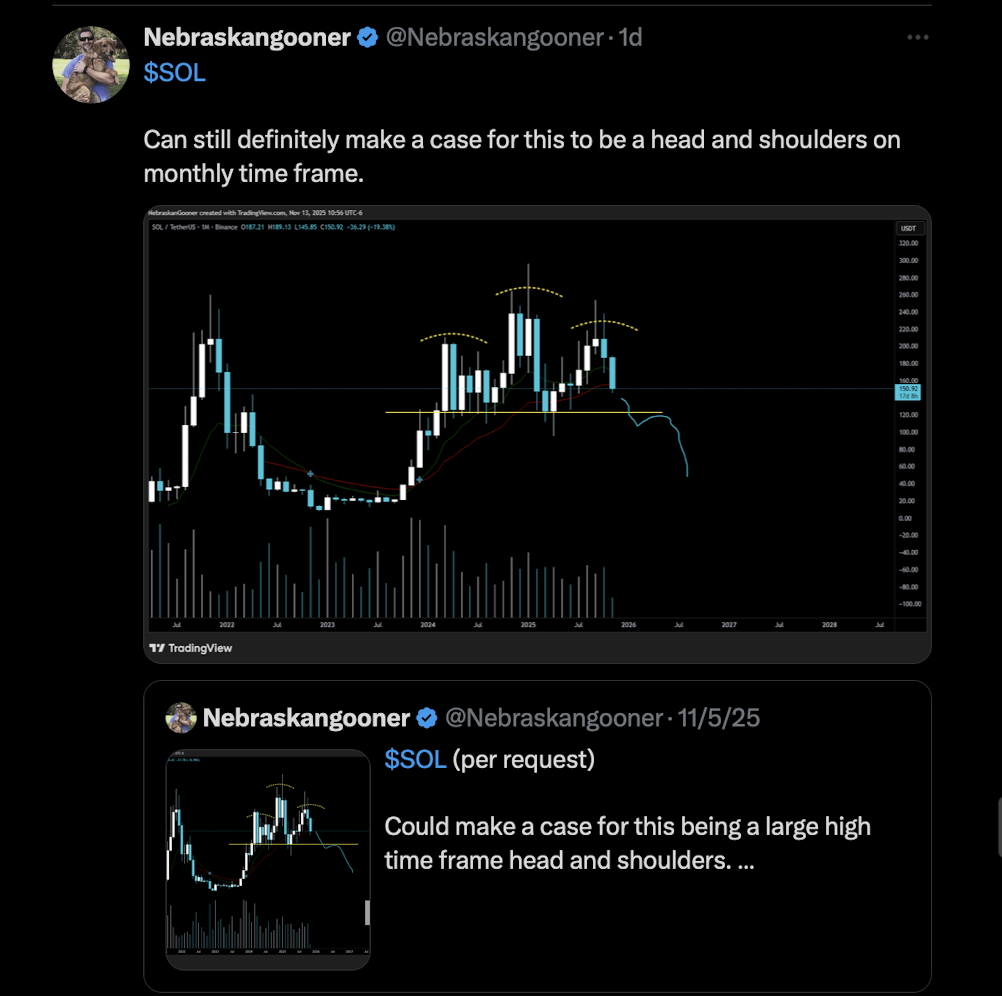
Zooming out, the chart also hints at a possible head-and-shoulders setup forming after SOL’s big rally. The neckline sits right in that $120–$125 zone, which makes it even more important. Volume on the latest shoulder looked weaker too—a classic sign that buyers are losing commitment as the structure matures.
Even without a confirmed breakdown, upside attempts keep hitting the same ceiling. Crypto Tony highlighted the $170–$177 area as the main rejection cluster. Almost every bounce struggles before reaching it or gets slapped back down inside that region.
Elliott Wave analysts see overlapping moves that usually signal corrective action, not a fresh impulse. So right now, the burden of proof sits on the bulls: only a strong break (and actual hold) above $170–$177 suggests the trend is repairing.
What Comes Next for Solana?
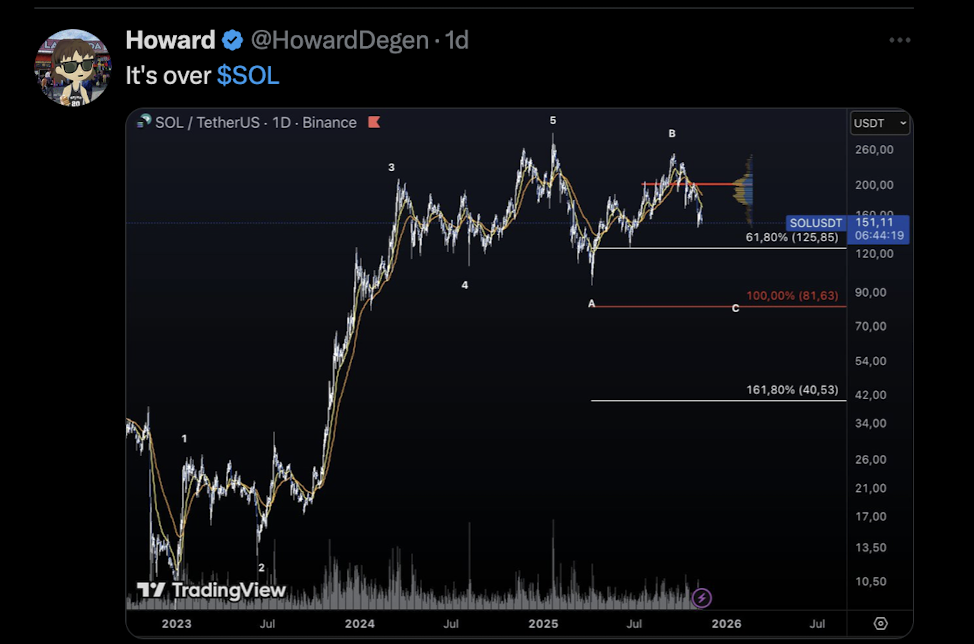
Several analysts pointed to a diagonal trendline running beneath months of higher lows. Solana actually broke below that trendline recently and failed to reclaim it. According to analyst Howard, that shift signals a move from accumulation into something more like redistribution.
Using Fibonacci projections, he mapped potential downside zones. The first sits around $125—lining up neatly with the neckline. A full extension hovers near $81 if things really weaken. A more extreme stretch reaches the $40–$50 area, though that’s more of a “just in case” roadmap than a prediction.
Volume under the $145–$150 range also thins out noticeably, meaning if SOL breaks cleanly, the drop could travel faster than traders expect.
But—there’s a twist.
ETF flows paint a very different picture. SOL products like BSOL and GSOL continue pulling steady net inflows, even with the chart trending down. That suggests institutions quietly accumulating while retail sentiment cools off. Historically, that’s been a pretty supportive long-term signal.
For the short term, though, everything still revolves around three key levels:
• Support at $145–$150
• The neckline at $120–$125
• Resistance at $170–$177
Until SOL breaks above that resistance cluster and actually sticks the landing, most analysts see the token stuck in a corrective phase—even if the bigger long-term story still looks healthy.