- Solana’s potential CME futures launch could attract institutional investors and boost its market credibility.
- SOL’s bullish breakout suggests possible targets at $316.25 and $343.03 if momentum sustains.
- Key support levels at $246.54 and $216.90 may offer buying opportunities in case of a pullback.
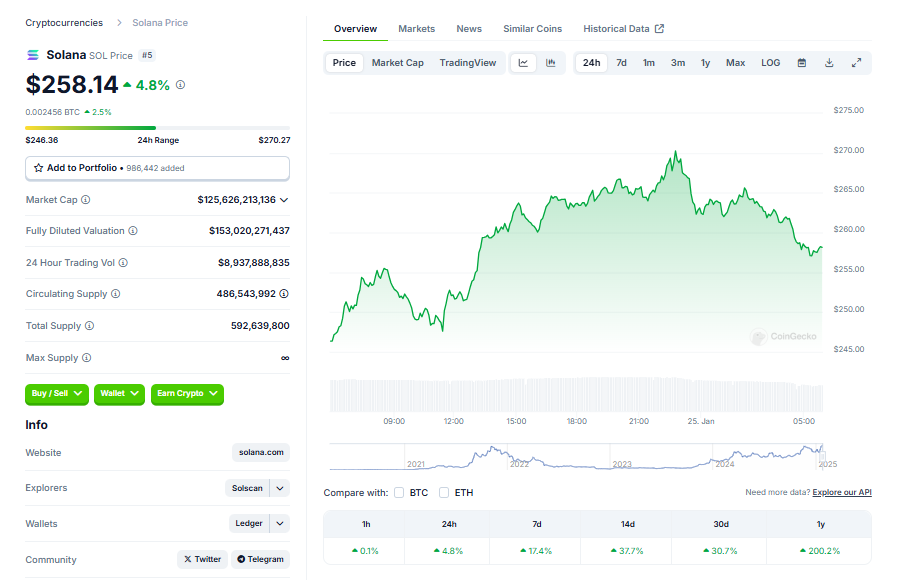
Solana (SOL) continues to draw attention in the crypto world, with whispers of an upcoming launch of SOL futures on the CME Group platform circulating in the market. If this rumor proves true, it could be a massive leap for Solana, as futures on a major exchange like CME would bring a sense of credibility and open the door to institutional investors who’ve been sitting on the sidelines.
Celebrated for its lightning-fast blockchain and minimal transaction costs, Solana has already carved out its niche as a top choice for decentralized applications (dApps) and DeFi projects. Adding CME futures to the mix could boost its appeal even further, injecting liquidity into the market and reinforcing its position as a heavyweight in the ever-evolving crypto landscape.
SOL Price Action: Bulls Eye $300 and Beyond
On the 4-hour chart, SOL is flashing signs of bullish strength after breaking out of a descending channel, which ended a corrective W-X-Y structure. This breakout ignited a powerful five-wave rally, sending SOL soaring to $294 before settling into its current consolidation phase.
Now, we see a symmetrical triangle taking shape—often a sign of indecision, but in this case, it has all the makings of a bull flag. If the trend holds, this pattern could set up SOL for another push to new highs. The Relative Strength Index (RSI) hovers just above neutral, hinting at increasing bullish momentum but leaving room for further gains.
Key levels to watch: immediate resistance sits at $264.87 (0.236 Fibonacci retracement), with strong support at $246.54 (0.382 Fibonacci level). A breakout beyond resistance could confirm the next leg of SOL’s upward journey.

Short-Term Price Prediction
Zooming into the 15-minute chart, SOL appears to be consolidating within a symmetrical triangle, following wave (v)’s peak at $294 on Jan 19. This pattern may either precede a bullish continuation or a short-term corrective pullback.
- Bullish Scenario: If SOL breaks upward, it could kick off a fresh impulse wave, with Fibonacci extensions pointing to potential targets at $316.25 (0.786 extension), $343.03 (1.0 extension), and even $420 (1.618 extension) in an extended rally.
- Bearish Scenario: A breakdown below the triangle could signal a move toward $216.90 (0.618 Fibonacci retracement), offering potential buy opportunities for those waiting on the sidelines.
Is the Correction Over?
The big question remains: has the ABC correction from Solana’s all-time high ended, or is there more downside to come?
In the bullish case, the correction may have ended on Jan 23 with a higher low at $242. If so, the uptrend could soon resume, aiming for a new all-time high. Conversely, in the bearish case, SOL could dip further to $216 before rallying.
Key Levels to Monitor
Resistance:
- Immediate: $264.87 (0.236 Fibonacci retracement).
- Key: $316.25 (0.786 Fibonacci extension).
- Major: $343.03 (1.0 Fibonacci extension).
Support:
- Immediate: $246.54 (0.382 Fibonacci retracement).
- Key: $216.90 (0.618 Fibonacci retracement).
- Critical: $195.81 (0.786 Fibonacci retracement).
Short-Term Target: Above $316.25 if bullish momentum builds.
Invalidation Zone: Below $216.90, suggesting further correction is likely.
This analysis uses Elliott Wave Theory, Fibonacci tools, and RSI to map potential paths for SOL. As consolidation continues, traders are watching closely—will the breakout confirm bulls are in control, or will bears get the upper hand? Stay tuned.


