
- SOL is trading near $82 within a historical accumulation “buy zone”
- Short-term patterns suggest a possible drop toward $52 if resistance isn’t reclaimed
- Both bullish and bearish scenarios remain valid, with $86 as the key level to watch
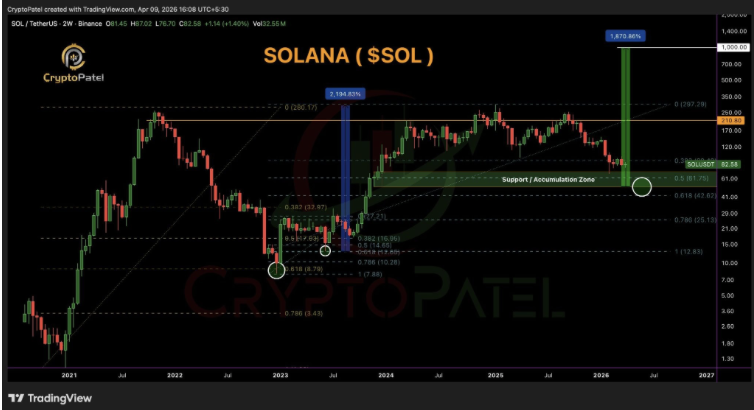
Solana is sitting in a spot that’s making a lot of people pause—and think. Right now, SOL is trading around $82, a long way down from the highs near $240. According to analyst Crypto Patel, this area falls right inside what he calls a “buy zone,” the same region that came before a massive 2,194% rally last cycle.
That’s the kind of stat that gets attention fast. But here’s the thing… not everyone is seeing it the same way.
The Bigger Picture Still Looks Like Accumulation
On the higher timeframe, the structure actually looks familiar. Patel’s chart highlights key Fibonacci levels, with the 0.5 level around $61.75 and the 0.618 near $42.62. Price hasn’t dropped that low yet, but it’s hovering in that broader range where the last major bottom formed.
And that’s important. Because last time, this was the zone where long-term buyers quietly stepped in before things really took off. Not all at once—but gradually, almost unnoticed at first.
So from that angle, nothing looks broken. If anything, it looks like early positioning.
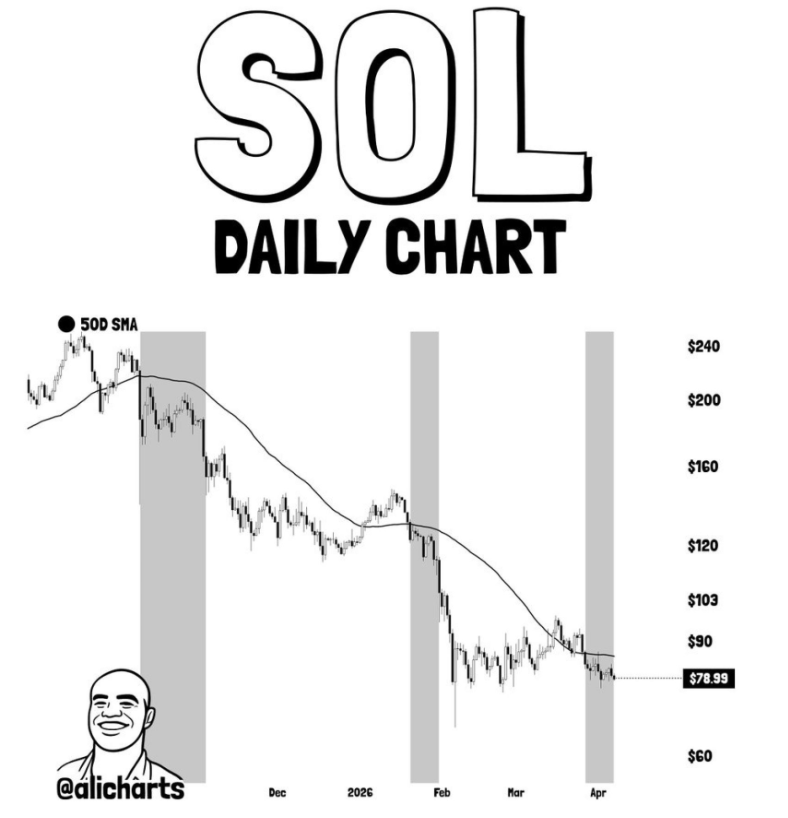
The Short-Term Chart Tells a Different Story
But zoom into the daily chart, and things get a bit more… uneasy. Analyst Ali Martinez has been tracking a repeating pattern that’s played out multiple times since October 2025. It’s not complicated, but it’s been accurate.
First comes the reclaim—price moves above the 50-day moving average. Then comes the failure—it drops back below. And finally, the consolidation phase, where price moves sideways before another leg down begins.
We’ve seen this pattern already. November. January. And now again.
SOL recently pushed above the 50-day SMA, hitting around $97, but then slipped back below it. Right now, it’s hovering around $79–$81, with the 50-day sitting higher at about $85.79. If this pattern continues… the sideways movement we’re seeing now might not be stability—it might just be a pause before another drop.
Two Views, One Market
So now you’ve got two completely different perspectives. On one side, Patel is looking at the macro structure—multi-year accumulation, Fibonacci zones, historical cycles. On the other, Ali is focused on short-term behavior, patterns that have consistently led to downside.
And the strange part? Both can be right.
A drop to $52, which Ali’s pattern suggests, would still fall right inside Patel’s buy zone. It wouldn’t break the bigger thesis—it would just mean a deeper entry before the next move higher.
The Key Level Everyone Is Watching
For now, everything seems to come down to one level: $86. That’s the line in the sand on the daily chart. If SOL can reclaim it and hold above, the bearish pattern starts to break down.
If it can’t… then the downside scenario becomes harder to ignore, and a move toward $52 starts to look more realistic.
A Market in Between Two Narratives
Right now, Solana feels stuck in the middle. It’s not low enough to feel like a clear bottom, but not strong enough to confirm a recovery either. It’s that awkward zone where both bulls and bears have a case—and neither has fully won yet.
The next few weeks will probably decide which direction takes over. Either SOL reclaims strength and pushes higher… or it dips deeper into that accumulation zone before anything bigger happens.
One way or another, though, this is a level that has mattered before. And markets have a habit of remembering.