- Solana remains below major moving averages despite a 4.5% daily bounce
- Resistance between $131 and $157 continues to cap upside attempts
- Valuation metrics suggest early accumulation, even as momentum stays bearish
Solana pushed higher on January 26, trading near $124.12 and posting a daily gain of about 4.5%. On the surface, that looks encouraging. Zoom out a bit, though, and the bigger picture hasn’t really changed. According to TradingView data, SOL is still firmly in a downtrend on the daily chart, sitting below all the major exponential moving averages, a sign that sellers continue to control the broader structure.
That tension is showing up across the market. Buyers have tried to steady prices a few times this month, but the wider crypto environment remains cautious. Traders are watching closely to see whether Solana, and other large altcoins, can defend current support levels or whether this bounce fades into another leg lower.
Solana Runs Into Resistance After January Bounce
On the daily timeframe, Solana remains trapped beneath the 20, 50, 100, and 200 EMAs. These averages are tightly clustered between roughly $131 and $157, creating a heavy resistance zone that’s capped every upside attempt in January. Each push toward that area has been met with selling, stopping any sustained move higher before it can really develop.
Bollinger Bands tell a similar story. SOL is trading in the lower half of the band, with the midline sitting near $135, almost perfectly aligned with the 20- and 50-day EMAs. After a steep drop through November and December, Solana did carve out a short-term bottom and attempted a recovery, but momentum has weakened since then. As long as price stays below these key averages, the move still looks corrective rather than the start of a true reversal.
Momentum Signals Still Favor Sellers
Momentum indicators haven’t offered much relief either. The Relative Strength Index is hovering around 40.8, well below the neutral 50 level. RSI showed some improvement early in January, but that strength has faded, suggesting buyers aren’t building enough pressure to shift the trend.
The MACD remains bearish as well. The MACD line is below the signal line, and the histogram is firmly red, pointing to ongoing downside momentum even as price attempts small rebounds. If Solana fails to reclaim the $131 to $135 zone, the risk is a pullback toward lower demand. Initial support sits around $118.50, followed by a broader demand area between $115 and $120, levels that have already been tested multiple times.
Valuation Data Hints at Early Accumulation
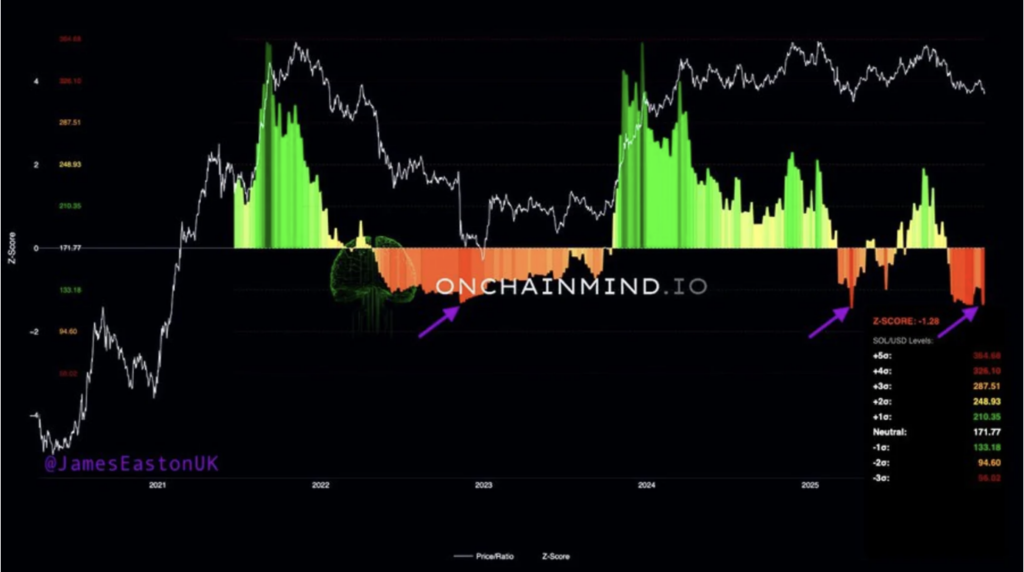
Looking beyond short-term price action, longer-term valuation metrics are starting to tell a more nuanced story. On January 26, analyst James noted that Solana’s valuation Z-score dropped to around -1.28, a level that suggests price is trading well below its long-term average. Historically, readings like this have appeared during extended bear phases, not near market tops.
Castillo Trading also pointed out similarities between the current setup and past cycles, where downside targets looked clear on paper but were quietly absorbed by early accumulation. That doesn’t mean a bottom is in, but it does hint that longer-term participants may be stepping in, even as the chart still looks heavy.
For now, Solana remains stuck between short-term weakness and longer-term value signals. The bounce helped sentiment a bit, but until key resistance levels are reclaimed, the market is likely to stay cautious.