
- The SEC might approve Solana ETFs in as little as 3–5 weeks after asking firms to revise and resubmit their filings.
- Major firms like VanEck, Bitwise, and Fidelity are in line—CoinShares and Rex-Osprey could be next.
- If SOL breaks out above $163, the next target is $183. RSI and MACD indicators support a bullish move, but $142 remains key support if things reverse.
Solana (SOL) had a nice little pop this Tuesday, climbing about 3% after word got out that the U.S. SEC might be warming up to the idea of Solana ETFs. According to a report from Blockworks, the SEC is now asking firms to resubmit their S-1 filings within the next week—and that has the market buzzing.
Apparently, the regulator wants issuers to tweak the language in their filings, especially around in-kind redemptions and staking strategies. That last bit—staking—might be the real surprise. If true, it’s a big shift from the SEC’s earlier stance when staking was pretty much off the table.
Solana ETFs Could Be Just Weeks Away
Sources cited in the Blockworks report suggest that the SEC might reply to these revised filings within 30 days. If all goes smoothly, Solana ETFs could get the green light in as little as three to five weeks. That’s fast, especially by SEC standards.
There’s a solid lineup of major players in the race too—VanEck, 21Shares, Grayscale, Bitwise, Fidelity, and more. CoinShares might join the fray soon as well, having registered a Solana ETF in Delaware recently. And then there’s Rex-Osprey, which seems to be testing the boundaries with some legal workarounds to speed things up.
ETF analysts Eric Balchunas and James Seyffart are feeling pretty optimistic. Balchunas even threw out a bold prediction: we might be on the verge of an “Altcoin ETF Summer,” with Solana leading the pack. They’ve upped the odds of a Solana ETF approval to 90%.
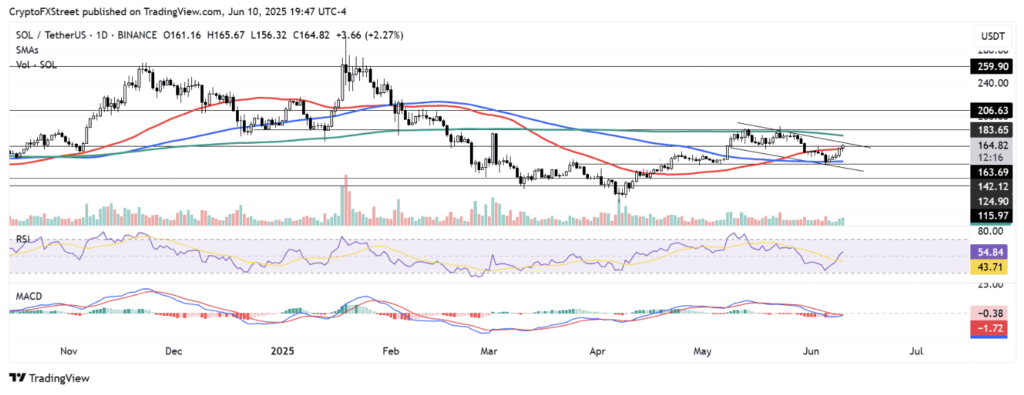
Price Eyes $183, But One Level Needs to Crack First
As for the charts? SOL is flirting with its 50-day Simple Moving Average right now, sitting near $163. If that holds as support—and if the price can manage to break out above the top of its descending channel—it might just push higher and test $183. That’s also where the 200-day SMA comes into play.
If bulls can’t hold that 50-day though, a slide back to $142 isn’t outta the question. On the momentum side, things are perking up. The RSI is creeping past its midline, hinting at growing strength. And the MACD? It’s just about to flip bullish, with a potential crossover above the signal line.