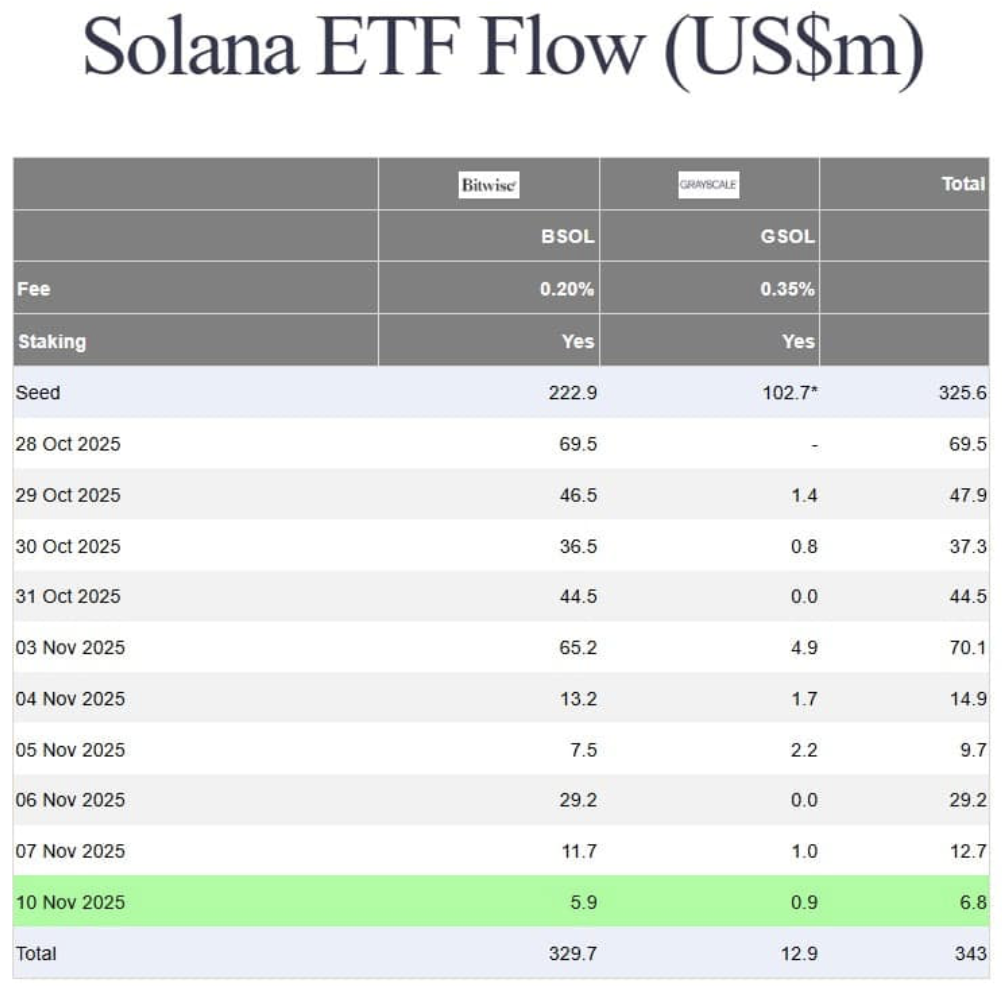
- Solana’s spot ETFs pulled in about $6.8 million in net inflows last week — more than both Bitcoin and Ethereum — with BSOL leading at $5.9M and GSOL adding $0.9M, bringing total ETF inflows to roughly $343M since launch.
- Derivatives data shows Open Interest holding steady around $3.4 billion and slightly negative funding rates, suggesting balanced sentiment and that SOL’s recent strength is driven more by spot and ETF demand than by leveraged speculation.
- Despite strong ETF flows, SOL is consolidating around $163, repeatedly rejected near $170, with muted RSI and neutral CMF; if $160 fails, a retest of the $150 zone looks likely before bulls can try for a cleaner breakout.
Solana has been moving a bit differently from the rest of the market lately. While everyone usually keeps their eyes glued to Bitcoin and Ethereum, SOL has been quietly flexing in the background, especially on the ETF front. Over the past week, Solana’s spot ETFs pulled in about $6.8 million in net inflows — more than both BTC and ETH managed over the same period. For a so-called “altcoin,” that’s a pretty loud statement.
According to data from Farside Investors, Solana’s spot ETFs kept up their strong run on the 10th of November. The Bitwise Solana ETF (BSOL) did most of the heavy lifting, grabbing roughly $5.9 million in fresh capital, while the Grayscale Solana ETF (GSOL) added around $0.9 million on top. It’s now the second week in a row that Solana has seen consistent ETF inflows, pushing its total flows since launch to about $343 million. Meanwhile, Bitcoin and Ethereum products sort of just… cruised, with fairly muted activity in comparison.
Derivatives show calm, not chaos
What’s even more interesting is that, under the hood, Solana’s derivatives market isn’t going crazy. You’d expect big ETF inflows to be paired with aggressive leveraged trading, but that’s not really what the data shows. Open Interest (OI) is sitting around $3.4 billion, and has been hovering there pretty steadily. That means traders are holding their positions without huge waves of liquidations, apes aping in, or leverage blowing up all over the place.
Funding rates are slightly negative, averaging around -0.0009, which hints at a mild bearish tilt — shorts paying longs, but not in some dramatic “everyone is fading the pump” sort of way. Put together, it suggests that Solana’s strength might be driven more by spot buying and ETF flows than by overleveraged speculation. Honestly, that’s about as healthy as it gets in crypto: slow, steady, and a little boring… in a good way.
Price stalls under resistance, despite ETF strength
On the price side, things are a bit more stubborn. At press time, Solana was trading near $163, down about 2.3% over the past 24 hours. The daily chart is showing some visible fatigue, even as those ETF inflows roll in. Price has been banging its head against the $170 zone and getting rejected more than once, which has led to a period of consolidation rather than a clean breakout.
Technicals back that idea up. The Relative Strength Index (RSI) isn’t exactly screaming “strong buying momentum” — it’s more muted, hinting that buyers aren’t really pressing their advantage yet. The Chaikin Money Flow (CMF) sits around 0.00, which basically says capital flows are neutral. In plain terms: the money coming in via ETFs isn’t fully showing up as aggressive spot demand on the chart… at least not yet.
If SOL can’t manage to hold above the $160 area, there’s a decent chance it drifts back down to retest the $150 zone before making any serious attempt at recovery. On the flip side, a strong push through that $170 resistance with real volume could flip the script pretty quickly. For now, though, the vibe is pretty clear: structurally strong, ETF-backed, but still wrestling with a technical ceiling that refuses to break — at least for the moment.