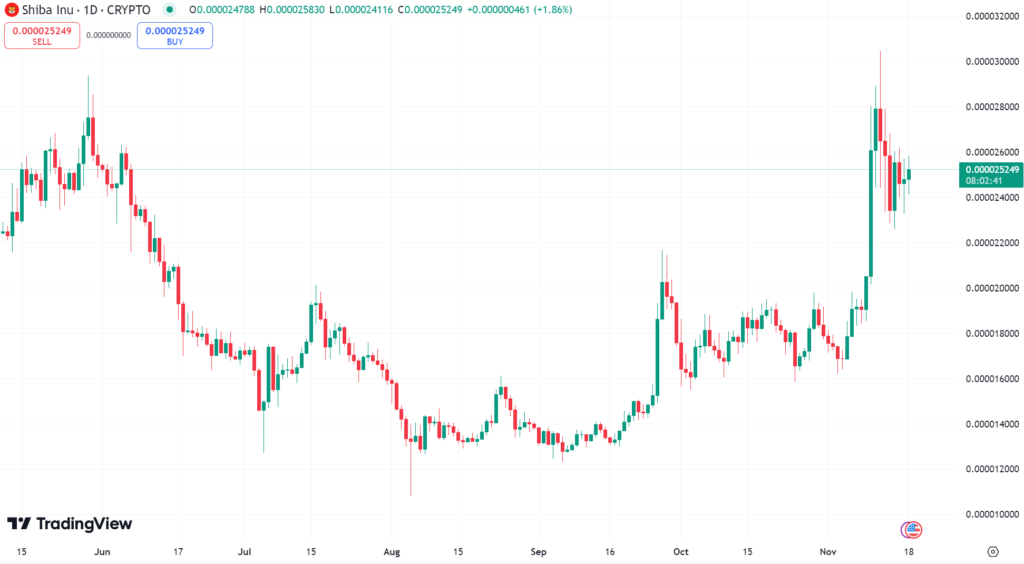
- SHIB’s price increased by 1.97% to trade at $0.000025277, maintaining an upward trajectory.
- Recent bullish movement reflects recovery from September lows and signals strong buying interest.
- Key resistance remains near $0.000030000, while support levels around $0.000022000 provide stability.
Shiba Inu (SHIB) continues its upward trend, with a 1.97% increase in price over the past 24 hours, as shown in TradingView’s daily candlestick chart. SHIB is currently trading at $0.000025277, demonstrating strong recovery and consistent growth following a significant dip earlier this year.

Source: TradingView
Recent Performance Highlights
The chart indicates SHIB has moved upward since September, breaking through key resistance levels in October and November. The recent rally pushed the token to test the $0.000030000 mark before encountering selling pressure. Despite a slight pullback, SHIB has maintained its position above $0.000024000, highlighting robust market interest.
October marked a critical turning point for the asset, with increased trading volumes coinciding with broader crypto market recovery. This bullish movement has been sustained through November, supported by growing investor confidence and network developments.
Technical Outlook
The daily chart showcases higher lows and higher highs, a classic indicator of an ongoing bullish trend. SHIB’s ability to sustain its position above the $0.000022000 support zone suggests continued buying interest at these levels. The next key resistance stands at $0.000030000, with a successful breakout potentially paving the way for further gains.
Indicators such as the Relative Strength Index (RSI) remain within neutral territory, leaving room for additional price growth without immediate concerns of overbought conditions. However, traders are advised to monitor price action closely, as any breach below support zones could signal a potential reversal.


