
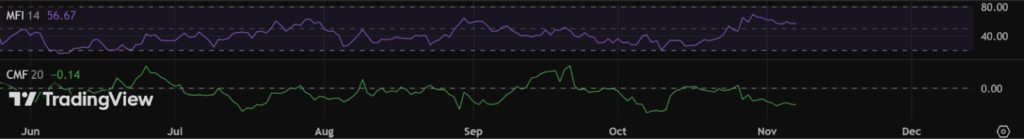
- Pi Coin’s indicators show quiet underlying strength, with the MFI near 56.7 hinting at steady accumulation since early October.
- A divergence between MFI (neutral-bullish) and CMF (negative) shows a tug-of-war between buyers and sellers, with a CMF move above zero likely confirming a bullish shift.
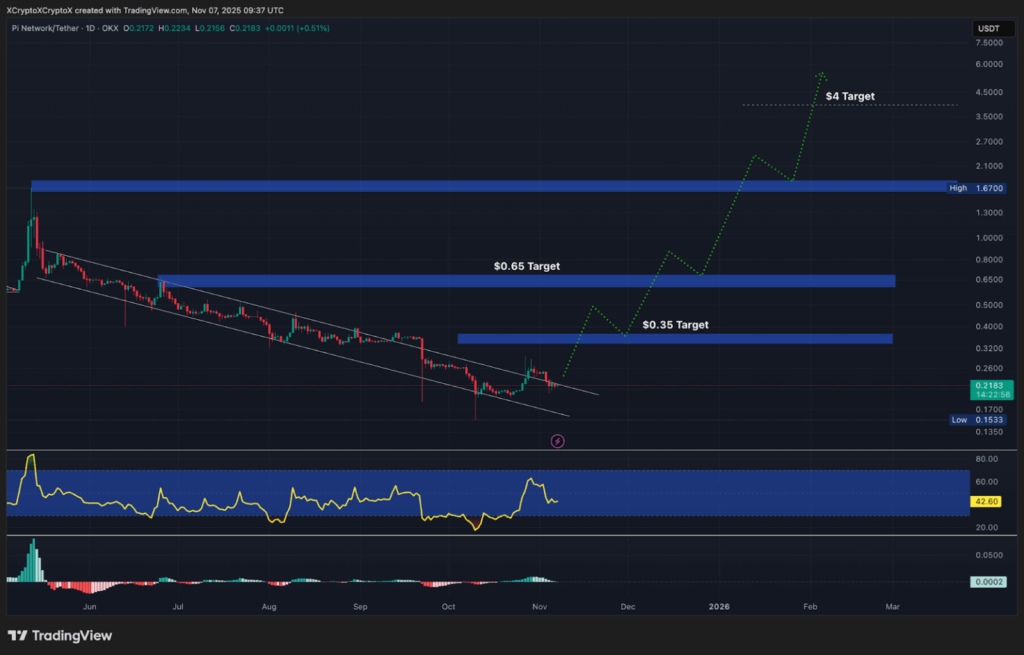
- Pi is trading inside a falling channel pattern, and a breakout with strong volume could target $0.35, then $0.65, and potentially as high as $4 in a larger multi-month reversal.
Pi Coin has been moving under the radar lately, but the charts are starting to whisper a different story. While price action looks calm on the surface, some of the underlying indicators are hinting at a slow build-up of strength, the kind that can sometimes come before a much bigger move. It’s not screaming “breakout” just yet, but the structure forming right now is the sort that traders don’t ignore for long.
Money Flow Shows a Tug-of-War
The Money Flow Index (MFI) is currently sitting around 56.67, which puts Pi in that neutral-to-bullish range — not overheated, not oversold, just quietly leaning to the upside. This kind of reading usually means buyers have been stepping in gradually, without turning it into a full-on FOMO rush. Since early October, inflows have stayed pretty steady, suggesting that accumulation has been happening in the background while most people weren’t really paying attention.
But it’s not all one-way traffic. The Chaikin Money Flow (CMF) is still negative at about -0.14, which tells us that some capital is still leaking out of the asset. That mismatch between MFI and CMF paints a picture of a market in balance, or maybe in conflict — buyers trying to build positions while others quietly sell into strength. If CMF manages to flip back above zero, that would be a strong signal that money is finally flowing in more decisively on the bullish side.
A Rare Falling Channel Pattern Takes Shape
On the daily chart, Pi is currently trading inside a long-term falling channel, a structure that’s often viewed as a bullish reversal setup rather than just a bleed-out. Price has tapped the lower trendline multiple times, but what’s interesting is that the RSI has been putting in higher lows at the same time. That kind of divergence hints that downside momentum is fading, even if the price doesn’t look impressive yet. It’s like the engine is revving quietly while the car still looks parked.
If Pi can finally punch through the upper boundary of this channel with a proper volume spike behind it, the first big test sits near the $0.35 level. Clear that, and the next hurdle lines up around $0.65. Beyond those resistance zones, a sustained breakout could unlock a much larger push toward the $4 region, which would mark a serious multi-month trend reversal instead of just another short-lived bounce. For now, it’s still early — but the pieces are starting to line up in a way that could surprise people who stopped watching.