
- XMR crashed nearly 64% in 22 days after topping near $798 as Bitcoin momentum faded
- Indicators confirm heavy sell pressure, with bearish moving average crossover and weak A/D readings
- If BTC bounces, XMR could retest $390–$420 or even $500, but those zones may act as sell traps
Monero (XMR) had one of those classic “too hot, too fast” rallies in January. The kind where price goes vertical, social feeds get loud, and suddenly everyone is a privacy coin maxi again. It even pushed to a fresh all-time high near $798. But right around that peak, Bitcoin (BTC) started losing momentum, and once BTC rolled over, the whole market mood flipped.
XMR didn’t just pull back. It got slammed. Over the next 22 days, Monero corrected roughly 63.7%, turning what looked like a clean breakout into a full-blown unwind. The irony is, the warning signs were already there. Social engagement around XMR exploded, and AMBCrypto had already flagged the move as obvious crowd FOMO. The spot volume bubble map also showed overheating signals, basically flashing “this is getting stretched” before the drop even started.
And sure enough, the correction hit just days later.
The Trendline Break Was the Real Red Flag
Once Monero failed to defend its long-term trendline support, the downside targets started opening up quickly. Analysts had highlighted the $266 area as the next major level, and by Friday, February 6, XMR printed a low around $276. Not quite $266 yet, but close enough to make the point: the market is no longer in “dip buying mode.” It’s in damage-control mode.
Selling Pressure Has Been Heavy, and It Shows in the Indicators
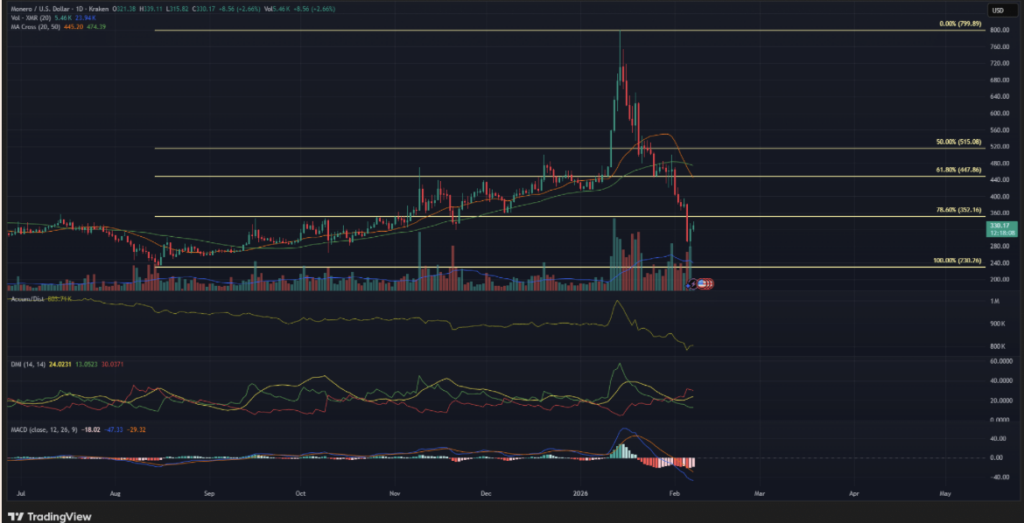
On the daily chart, the sell pressure hasn’t been subtle. The A/D (Accumulation/Distribution) indicator dropped to fresh multi-month lows, confirming that this wasn’t just a light correction. Real volume came in on the sell side, and it’s the kind of activity that tends to leave a scar on the chart for a while.
At the same time, the 20-day and 50-day moving averages printed a bearish crossover, snapping a four-month bullish trend and reinforcing the idea that momentum has shifted. The DMI also pointed to a strong downtrend, which honestly matches what your eyes already see: lower highs, heavy candles, and weak rebounds.
$352 Was the Bulls’ Last Hope, and It Failed
If there was one level that could’ve saved the structure, it was around $352. That was the 78.6% Fibonacci retracement level of the rally from roughly $230 to $799, and it was basically the last meaningful “bounce zone” before the market started looking truly bearish.
But the retest didn’t hold. It didn’t even get a strong reaction. That’s what makes this setup feel heavy. Levels that acted like support just a few weeks ago have now flipped into supply zones, meaning sellers are using rebounds as exits, not buyers stepping in with conviction.
And when $352 failed, it sent a pretty clear message: the run is over, at least for now.
What Traders Should Expect Next
The downtrend is still the base case. That doesn’t mean XMR can’t bounce, because it absolutely can. In fact, it might even pause and range at certain levels if Bitcoin and major altcoins catch a relief rally inside their own longer-term downtrends.
But any bounce, at least in the near term, looks more like a retest opportunity than the start of a new uptrend. That’s just how these post-parabolic charts tend to behave. They don’t go straight back up. They usually grind, trap late buyers, and bleed.
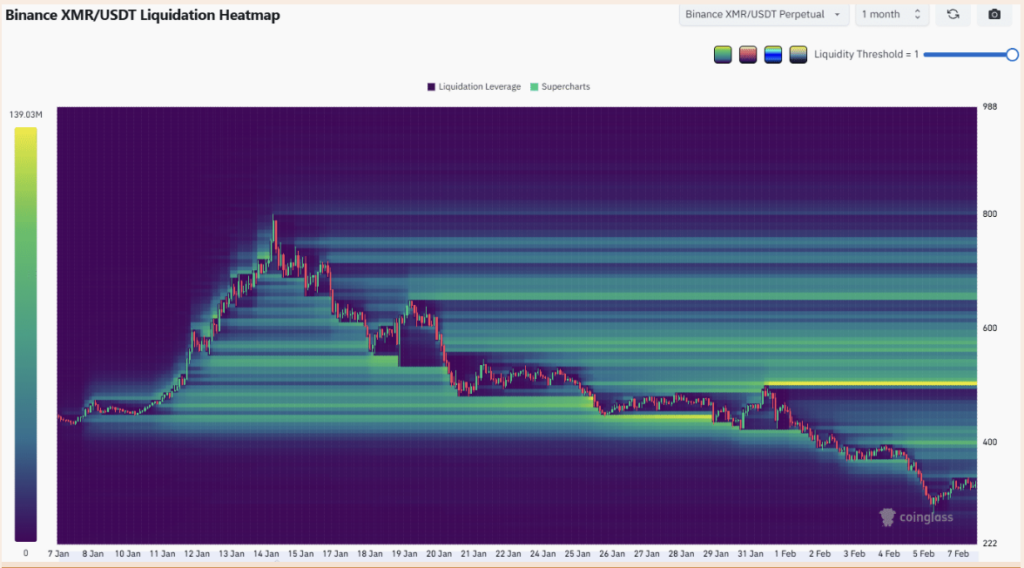
Liquidation Heatmap Shows Where a Bounce Could Get Rejected
Looking at liquidation heatmaps, the next major “magnetic zones” sit higher up the chart. The key areas to watch are around $390–$420, and then the $500 region after that. These zones often act like price magnets during rebounds, especially when the market is searching for liquidity.
If Bitcoin bounces, XMR could easily get pulled toward those levels. But if it does, traders should also be prepared for another bearish reaction once those zones are tapped. That’s where liquidations and trapped positioning often reset.
In short, Monero’s parabolic rally already played out. Now it’s in the part of the cycle where the chart is trying to find a new base, and that process is rarely clean.