
- Litecoin is trading sideways near $80 as the market waits for Bitcoin’s direction
- Key resistance sits at $86.60, while a break below $80 could accelerate losses
- Weekly momentum indicators remain negative, limiting upside potential for now
Litecoin is stuck in a waiting game, and the chart shows it. Price action has turned hesitant, with no strong push from either side, as the broader market looks to Bitcoin for direction. For now, traders are keeping a close eye on nearby support and resistance zones, knowing the next move likely won’t come from Litecoin alone.
At the time of writing, Litecoin is trading around $81.65, posting a modest 0.64% gain over the past 24 hours. Daily trading volume sits near $580 million, while market capitalization stands at roughly $6.26 billion. The numbers are steady, but they don’t tell a story of conviction, more like pause and wait.
Bitcoin Still Sets the Tone
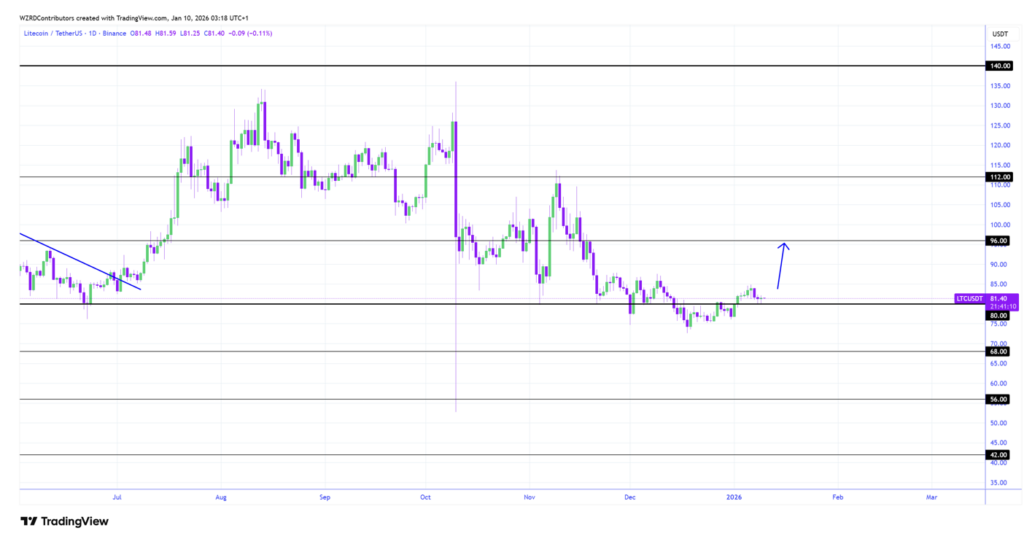
Crypto analyst CRYPTOWZRD recently pointed out that Litecoin closed its daily session without any real directional bias. According to the analysis, Bitcoin’s next move will likely dictate what happens next across the board, Litecoin included. If price slips below the $80 mark, further downside could follow. On the other hand, strength above $86.60 may reopen the door for buyers.
The daily LTC/USD and LTC/BTC charts both reflect this indecision. Notably, a dragonfly doji formed on the LTC/BTC pair, a pattern that can hint at a potential upside break. Still, that signal only matters if Bitcoin dominance shifts in a way that allows altcoins some breathing room.
Tight Range Keeps Traders on Edge
On an intraday basis, Litecoin continues to trade inside a narrow range, hovering just above the $80 support zone. A mild pullback followed by stabilization could send price back toward the $86.60 resistance area. That level has capped upside attempts before, so a clean move through it would matter.
However, a breakdown below $80 changes the picture quickly. That would likely drag LTC into a more clearly bearish zone, where buyers tend to step back rather than step in. With market confidence mixed, the next few sessions could be heavily influenced by how Bitcoin behaves in the near term.
Weekly Indicators Still Lean Bearish
Zooming out to the weekly timeframe, the pressure becomes more obvious. Litecoin is trading below the MA Ribbon, with the 20 SMA near $96.10, the 50 SMA around $97.88, the 100 SMA close to $90.48, and the 200 SMA near $83.22. Sitting below all of these averages keeps the broader trend slightly negative.
Momentum indicators aren’t offering much relief either. RSI is hovering around 41.94, suggesting weak bullish momentum, but not yet deeply oversold. MACD remains in negative territory, with the MACD line at -2.26 and the signal line at -3.94. The histogram stays red, reinforcing the idea that downside pressure hasn’t fully faded.
Until MACD flips positive and price reclaims key averages, any recovery attempt may struggle to gain traction. For now, Litecoin remains balanced on a thin edge, waiting for Bitcoin to make the first move.